The Dow Theory, a longstanding market analysis tool, identifies a Primary Bear Market when the DJIA and the Dow Transports decline below their prior significant lows, confirming a downward trend.
As of late March 2025, the Dow Theory has signaled the onset of a Primary Bear Market.
This bearish confirmation occurred on March 11, 2025 when the DJIA closed at 41,433, breaching its primary support level of 42,000. This decline followed a bearish signal from the Transports which had previously fallen below its primary support level.
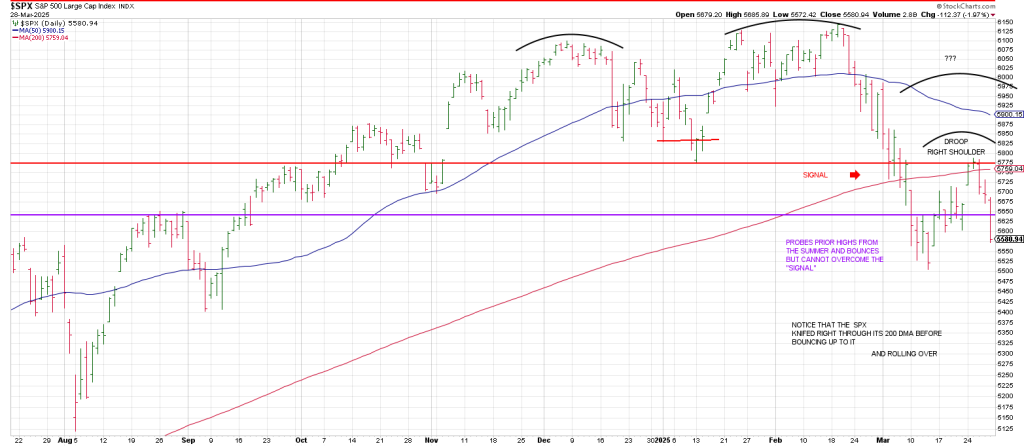
Further corroborating this bearish outlook, the SPX indicated a primary downtrend after breaking support at 5774-5846.
That was the low and close on January 13th.
Since the summer I’ve been comparing the current cycle to 1929.
Let’s compare the SPX with the DJIA in 1929.
In some ways the SPX is weaker than the DJIA in 1929.
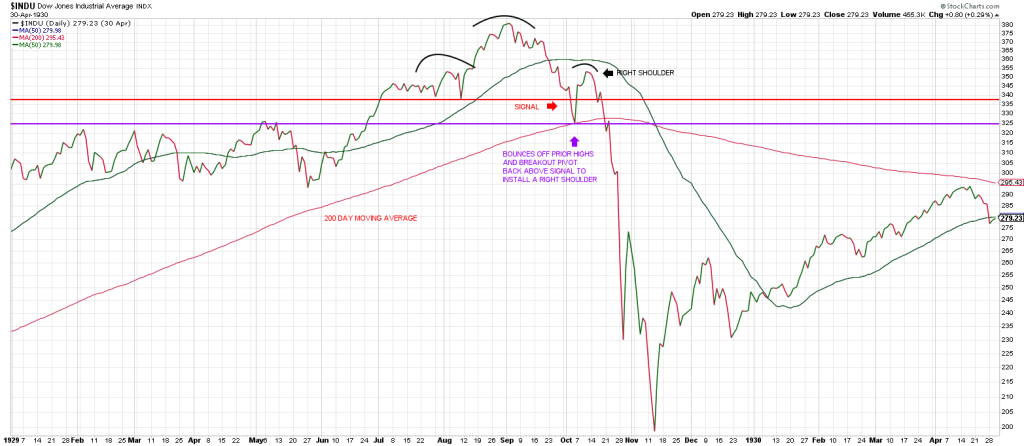
In 1929 it took 23 trading days for the DJIA to drop to its 200 day moving average.
In 2025 it took 11 trading days to fall to its 200 day moving average.
The Dow Theory Sell signal triggered 22 days from the top in 1929 basically synonymous with the tag of the 200 dma on the 23rd trading day.
The SPX dropped below its prior major swing support (similar to a Dow Theory sell) on the 9th trading day from the top in 2025.
Checking the first 1929 chart, the red arrow shows where the Dow Theory Sell was issued.
That sell immediately elicited a drop to the prior breakout pivot over prior triple tops (purple) in tandem with a picture perfect text of the 200 day moving average.
Notice the bounce off the textbook support at the prior highs (purple) perpetuated a rally BACK ABOVE the sell signal
As I’ve said many times, the markets job #1 is to deceive.
The push above the Dow Theory Sell signal following a “successful” test of the 200 day ma meant the coast was clear, right?
No so much.
It was the mother of all hooks.
It installed a right shoulder of a Head and Shoulder Top
Notably the H&S projection was the 284 region which the DJIA went thru like a knife thru butter.
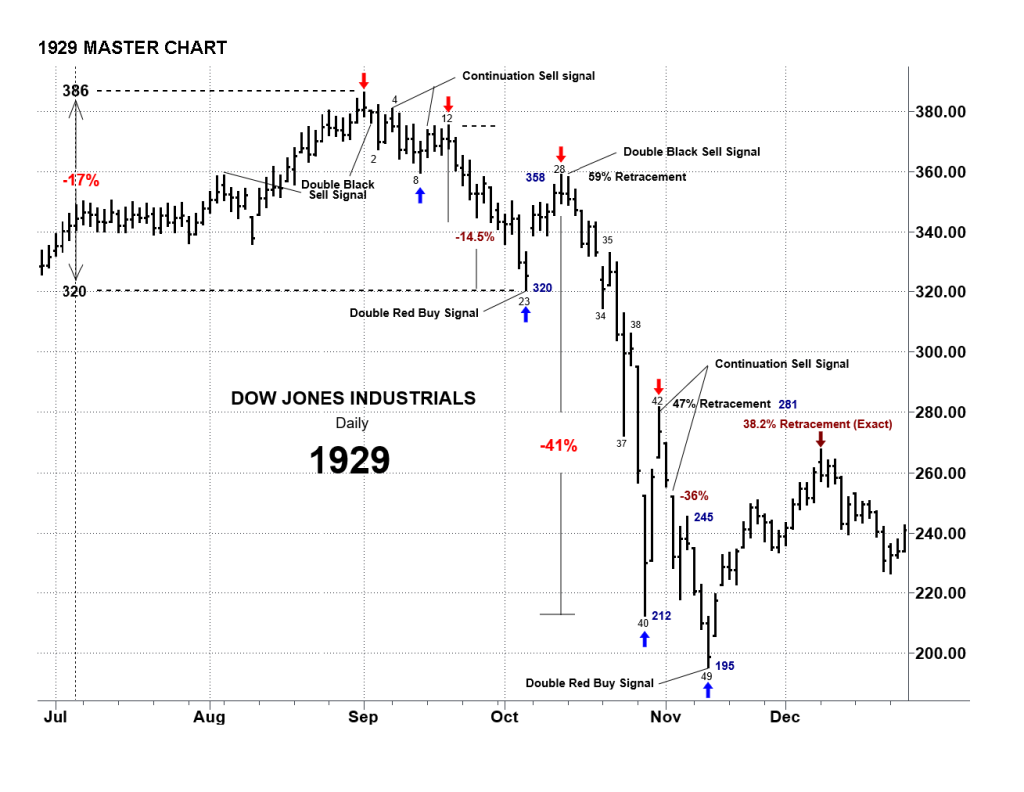
The DJIA bounced off the 1929 crash low into mid-April 1930…striking the 284 region.
This year mid-April may see a crash if the time counts correlate.
The air came out of the bubble in 1929 on the 37th trading day from high, on October 24th, the first of THREE crash days.
The other crash days were October 28th and October 29th, the 39th and 40th trading day respectively.
The whole debacle wasn’t over until the 49th trading day from high, November 13, 1929.
Today, March 31st, is the 28 trading day from high.
Interestingly, trading day 28 was the last rally high before the waterfall in 1929.
Is a mirror image foldback playing out with day 28 being a pivot low today on a test/undercut of the March 13 low.
Allow me to recap some of the harmonics between 1929 and 20025.
The high close in 1929 was 381 DJIA.
381 squares out with the year 2025.
October 28, the biggest % down day in 1929 squares out with January 24, the primary high day in 2025 (so far).
Both square out with 92.5.The Jan/Feb high is 92.5 years from 1932, the low after the Great Crash.
We have shown before how it is 58 years from 1929 to the 1987 crash.
58 aligns with 92.5 and squares out with Oct 28/29 and January 24th.
In other words if in 1987 you recognized a nearly identical pattern was playing out and anchored ‘0’ to 58 for 58 years prior you would have seen that this pointed to the big crashes in 1929.
2025 is 38 years from 1987.
On the Square of 9 Wheel 38 is opposite Oct 28 and 29 and squares January 24th.
So here we are 38 years from the synchronicity between 1929 and 1987 with 38 pointing to the crash in 1929 just as 58 had in 1987.
In sum the year 1929 squares out with Feb 17 within a few days of the all time high in 2025…
Just as the high close in 1929 squares the year 2025.
The idealized time frame for a crash, if one is going to occur on the same synergistic parallels, is mid-April.
April 16th is opposite October 19th, Black Monday in 1987 and the rally high in 1930 before the 27 month road to perdition.
March 13 was a Time/Price square-out.
This because the high price 6147 (614/615) squares March 13.
It will be important to see if we get a successful test followed by a rally to put a “hook” in…ala 1929.