“Time rearranges” Take A Picture Of This, Don Henley
What are the odds that eight of the greatest market crashes history would all occur within six days before to three days after a full moon that fell within six weeks of a solar eclipse?
According to market watcher Steve Puetz, the probability is so small that it stands out as a statistical anomaly, ultimately leading him to define what is now known as the Puetz Crash Window.
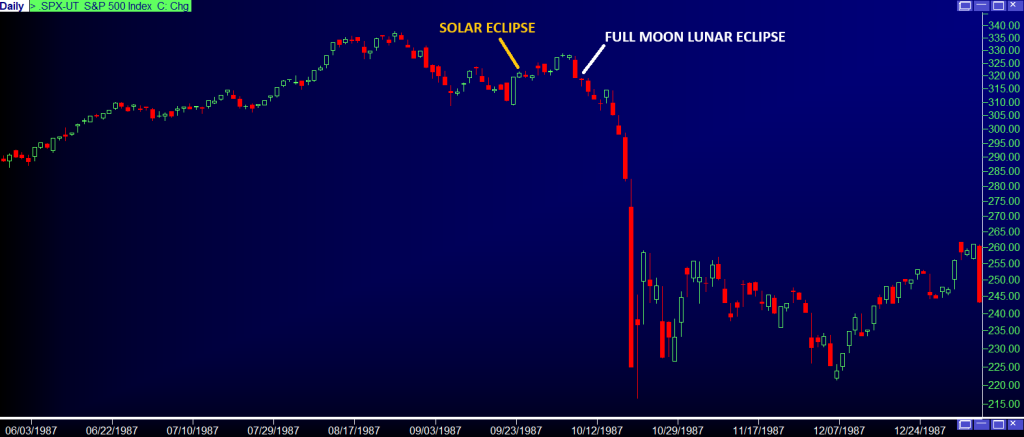
Puetz’s theory suggests that crashes most often begin after the first full moon following a solar eclipse when that full moon is also a lunar eclipse. In this pattern, markets tend to peak a few days ahead of the eclipse full moon, then drift sideways to slightly lower as the date approaches. Once the full moon arrives, or just after, the panic phase begins, typically lasting two to four weeks.
This Puetz Crash Window aligns in 2026. We saw the solar eclipse on February 17, 2026, which will be followed by a full moon and total lunar eclipse on March 3, 2026.
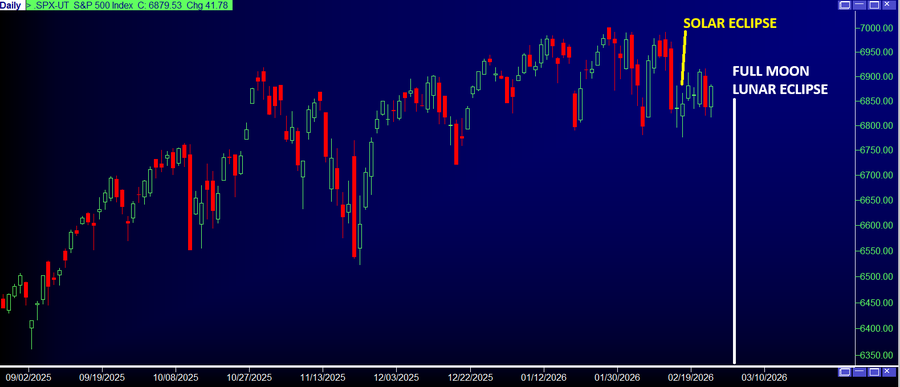
Under Puetz’s framework, the idealized market peak would have occurred 2-4 days before the eclipse full moon, placing the expected high between February 27 and March 2, the final trading sessions before the lunar eclipse trigger date.
Below is a daily SPX depicting the pattern going into the 1987 crash.
Here is projection of where we are in this pattern currently
Notice that in 1987 the crash did not come directly off the high. It came 7 weeks after the high, the Gann Panic Window.
The current all-time high was January 28.
The Gann Panic Window is March 9th to March 21st.
What’s intriguing is that March 9 ties to the closing low in 2009 and the NAZ bull market high on March 10, 2000.
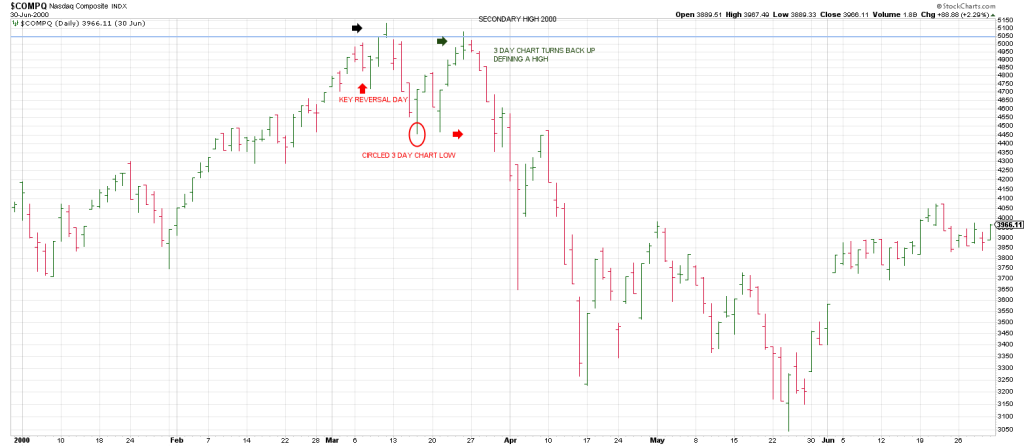
Notice the signal reversal bar on the top day on March 10, 2000,
What’s interesting is that there was a Key Reversal Day three trading days prior: the first mouse (first sell signal) got the squeeze, the second sell signal (a Lizard, 10 day new high Topping Tail), got the cheese for the bear.
The NAZ 3 Day Chart turned down on March 15– right off the high. It turned back up perfecting a Secondary High on March 24.
When the NAZ declined below the circled 3 Day Chart low which occurred on March 16th, a top was confirmed triggering a Get Out of Dodge sell signal.
The bulls were ambushed as the 50 day moving average broke with authority producing a slide to the 200 day moving average.
Notably the 3 Day Chart turned back up on April 7th—defining a high before a continued slide.
In the current structure the NAZ struck a high on October 29th.
Subsequently it looks like a 1 2 3 Swing to a Test of the all-time high played out into January 28th , 90 geometric days/degrees later.
The angle of attack to the downside since the January 28th Secondary High underpins the bearish setup.
As well the NAZ shows what looks like an inverse Cup and Handle.
The Handle is the last 5 trading days.
When the NAZ “comes out” of the Handle (to the downside), it should attack the 200 day moving average with accelerated momentum.
In fact a gap BELOW the 200 dma currently at 21,950, would be a blaring siren mirroring the play book from 1987.
Below is a daily SPX going into the Black Monday in 1987.
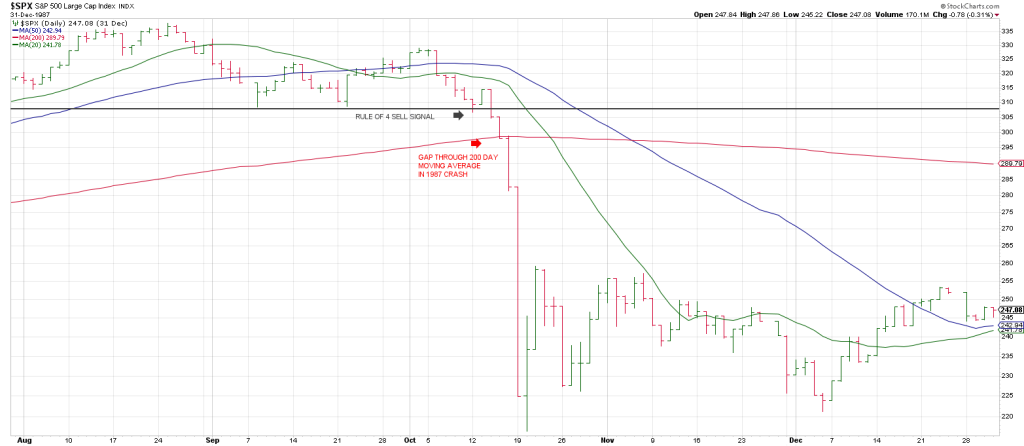
When you get a Runaway Move as the SPX had going into the 1987 peak and then turn down and the 200 day moving average fails to act as support first time down, the presumption is a crash will play out.
Notice in 1987 that a Rule of 4 Sell signal preceded the crash mirroring the triple bottoms in the SPX currently.
Conclusion. We have entered into the Puetz Crash Window. That does not guarantee a crash: while all major crashes have occurred in the belly of the Puetz Crash Window, we have not crashed every time the Puetz Crash Window is “open”.
Think of it this way: W.D. Gann said “All important highs and lows are square-outs.”
But what he did not add, is that not every square-out is a major high or low.
It depends on the CONDITIONS and the CYCLES.
The conditions internally are weak. This is reflected by the cluster of Hindenburg Omens discussed in yesterday’s report.
The more Hindenburgs, the greater the odds of something bad.
Tuesday produced the second Hindenburg Omen signal THIS WEEK (and it’s only Tuesday).
That condition reflects a fractured internal market structure, where new highs are expanding while new lows are elevated.
Historically, such divergence is not a timing tool, but it is a warning: risk is rising beneath the surface even as the major averages press higher.
For now, price is the final arbiter…but Time Turns Trend and the cycles are bearing down.
If panic breaks out where might the market go?
Using the SPY high of 698 a 360 degree drop is 596.