“You leapt from crumbling bridges watching cityscapes turn to dust
Filming helicopters crashing in the ocean from way above.” Apocalypse, Cigarettes After Sex
I’ve been counting this potential crash pattern using the Primary High of January 24th.
However, I realize we must consider a count from February 19th, the actual high.
Doing so alters the Gann Panic Window somewhat.
It means the heart of history, starts from a last rally pivot high on April 1st, 2025.
On the DJIA chart below from the second half of 1929, that equates to the 28th trading day from the September 3 peak.
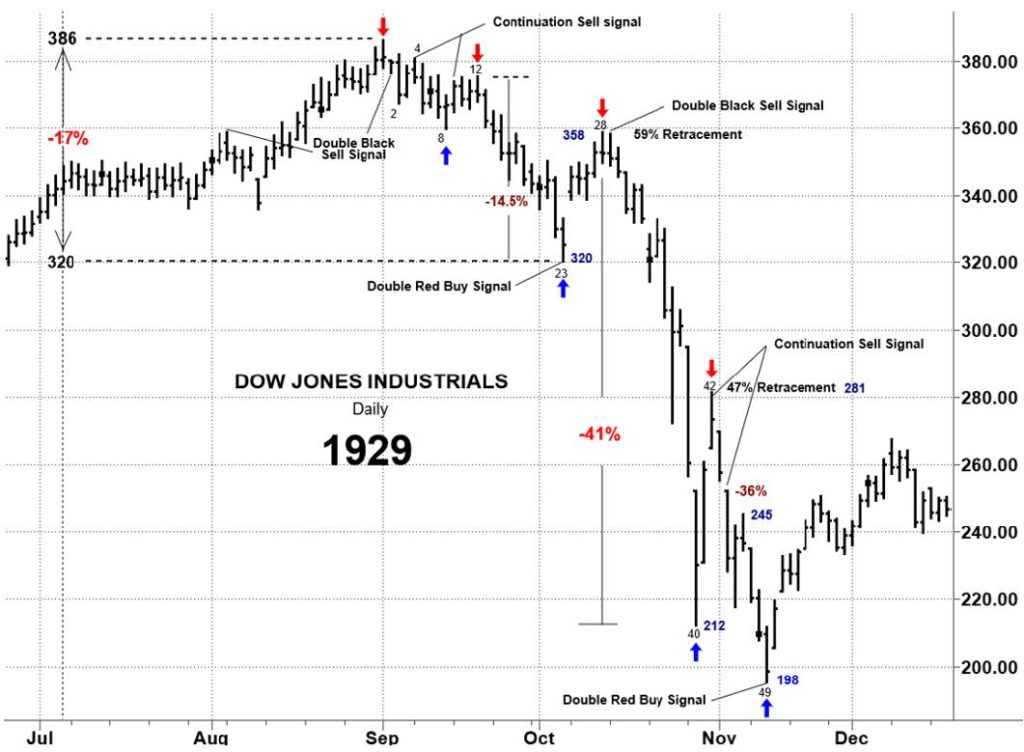
The 28th trading day from the Sept 3, 1929 high follow a 5 day rally from the first leg down from the top.
That first leg down was approximately 17%.
Importantly it took the DJIA back to where the last ditch rally started, where the blow off to the top started.
The blow off prior to this years 6147 record high started from the early August Flash Crash low at 5119.
That is roughly equivalent in percentage terms to the size of the first leg down in 1929.
From the bottom of the first leg down of 320 the DJIA rallied to close to 360 in FIVE trading days.
Approximately 13% in five trading days.
Remarkable.
Then came THE CRASH.
On November 1st 1929 there was a solar eclipse, 2 days after the October 29th crash day.
Notice that 2 days after the October 29 waterfall day in 1929 there was a rally high.
it was the pivot high of a massive Snapback of around 30%.
The DJIA rallied 30% in 2 days.
Remarkable squared.
In today’s market that would equate to around a 1500 point SPX rally in 2 days.
To paraphrase Jack Nicolson in A Few Good Men—You want volatility, you can’t handle volatility.
From the end of October 1929, the two day rally peak, third of the 3 crash legs started.
A clear 5 wave impulsive decline defined the 1929 waterfall.
When most traders think about the 1929, they think about a one-way train wreck.
The truth is there were two trains going in the opposite direction at the beginning and the tail end of the debacle.
The countertrend Wave 2 and Wave 4 rallies in 1929 are testimony to the adage, the biggest rallies are in the midst of bear markets.
This year we get a solar eclipse on April 1st, when the Gann Panic Window opens STARTING THE COUNT FROM THE FEBRUARY 19, 2025 PEAK.
Today we get the Fed. Powell gets to step into a whirlwind.
is there anything he can or cannot say that will change the market’s date with destiny?
Is the Fed Put even a thing anymore? Any more than the Trump Put?
The Fed is front and center at the crossroads of turbulence. Again.
The Fed was presumably founded on the premise of preventing panics.
Yet it has reigned over cycles of boom and bust since it was started in 1913.
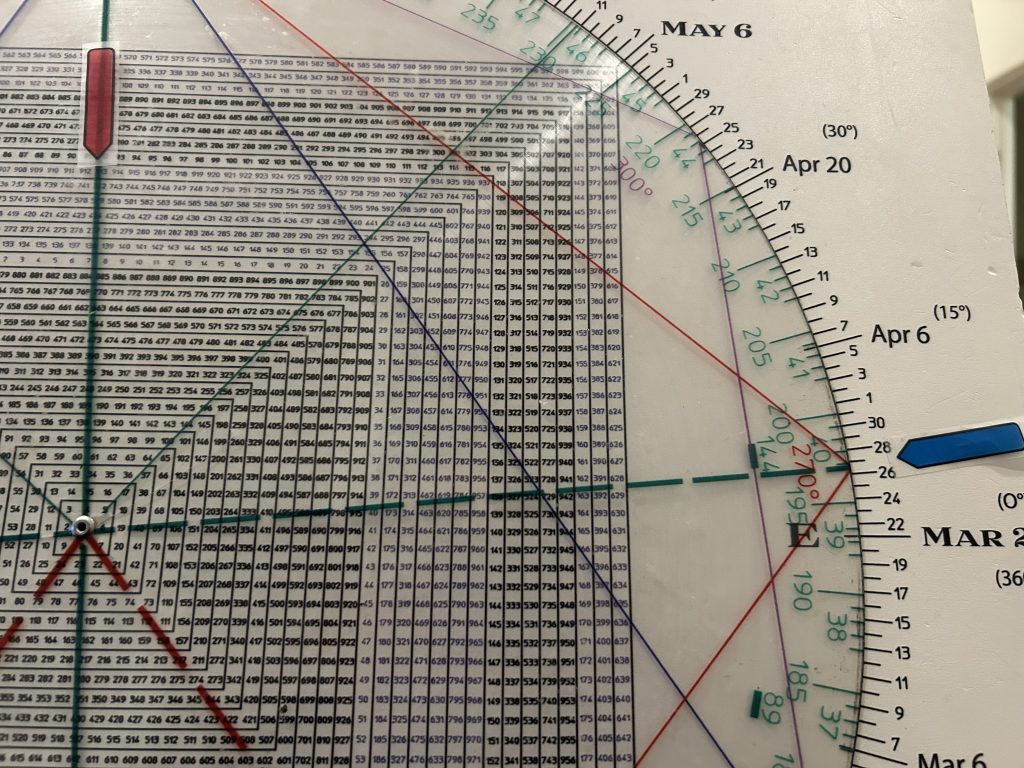
Checking the Square of 9. 1913 squares out with late March, when we get a solar eclipse
We haven’t had a Black and Blue Friday/Monday scenario since 1987.
The Plunge Protection Team wouldn’t allow it.
That said when there has been a big up day on the Friday before a monthly OpEx such as last Friday, the next Friday is down hard.
Friday and Monday tie to Gann’s panic cycle counting from the January 24th peak.
In sum, Monday the SPX went into a daily Minus One/Plus Two sell setup and the market pulled back sharply on Tuesday.
Breakage below Friday’s low produces a Jump the Creek sell signal offsetting Friday’s Breakaway Gap.
It may be a point of recognition for the ages.