The New York Composite Index struck a record high on Tuesday, a few cents above Monday’s all-time high.
Was it a Cheech and Chong one more good high head in the clouds rally before the buy the dip hallucination wears off?

This weeks NYA record was not exactly the pinnacle of a run for the roses.
We’ve been here before —in mid-July, late July—when NYA formed a double top.
With this weeks marginal new high we may have a Gann M A Top on the table…a 3 month distribution pattern.
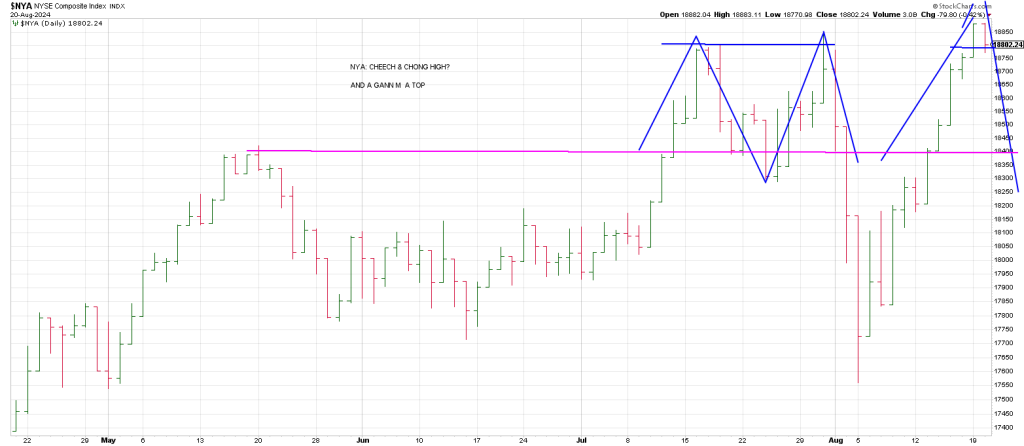
The July double tops are the “M” with this week being a possible “A”
The “feet” of the “M” align with May high.
The way the Gann M A works in signaling a Top is that a reversal back thru the double tops of the “A” is a warning sign.
Breakage below the feet of the “M” is often a blaring sell siren.
Notably Tuesday’s record high was short lived with the NYA reversing on Turnaround Tuesday leaving Train Tracks.
The New York Composite pulled back to test the tops of the “M”.
Downside follow through will trigger a Soup Nazi sell signal.
This is a strategy I developed that does a good job of identifying false breakouts.
It is a reversal back down through a prior swing high within the last 20 days (with at least a 4 day interval between the highs in the 20 day lookback).
The SPX broke an 8 day win streak on Tuesday.
That said the index has not traded below a prior days low since the August 5th low.
To say it is stretched is an understatement.
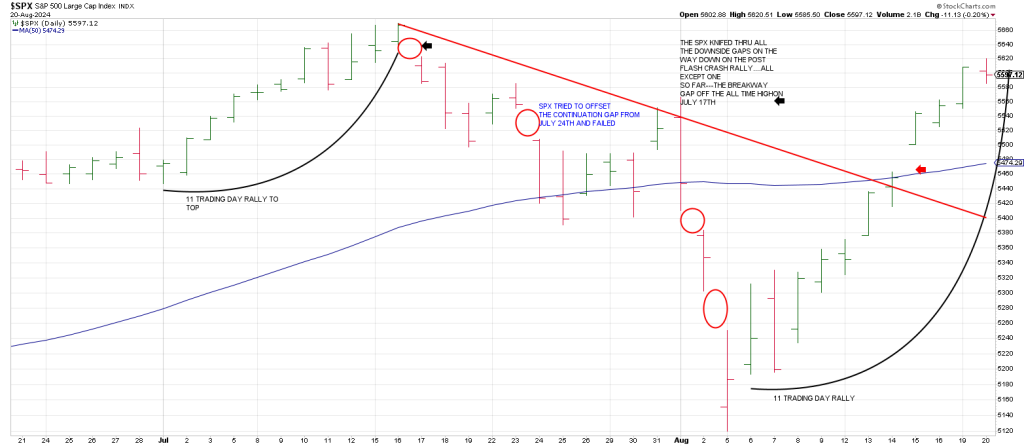
Tuesday equates to the 11 day run up into the July 16th top.
In fact on Monday the Equities Call/Put Ratio registered the most bullish expectation of any day for 2024. The reading was a tad above that scored at the July 16th peak.
The above daily SPX reveals a few things:
- When the SPX closed above a Tops Line on August 14th, it exploded the next day.
- August 14th saw a large gap above the widely-watched 50 day line which perpetuated a solid tail wind the last 3 days.
- That momentum was telegraphed by the SPX offsetting the downside gaps on August 2nd and August 5th— and July 24th. There is only one gap that the SPX has failed to conquer: the Breakaway Gap from July 17th, the day after the top.
The July 24th instance is an important pivot. The SPX tried to offset that pivot on July 31st and August 1st. When it failed we got the Flash Crash.
To bulls and bears alike it is hard not to imagine the SPX has come this far this fast not to clear the Breakaway Gap off the top.
But that’s exactly how Mr. Market roles…He may not ‘fix the hole’.
What everyone thinks is obvious in the markets is often, obviously wrong.
As flagged on the Hit and Run Private Twitter Feed on Tuesday, 180 degrees down from Tuesday’s high is the 5470 region.
This ties to the 50 day moving average and Phil D Gap from August 15th.
Will the SPX “fix the hole”.
Could we see a Duck Dive on Wednesday toward the 5470’s?
Maybe.
Every month the government releases a number that indicates that the U.S. economy has been creating plenty of jobs, and then later on that number is dramatically revised lower. Bu the time it is revised lower, it gets lost in the shuffle.
The fake numbers that are initially released month after month give Americans the impression the economy is performing better than it actually is. Now we are about to get another major revision to the employment numbers which only happens once per year.
Today.
My sources say we could get a million job revision.
If the employment revision that we get today is large enough, it could spark another round of selling.
While the market has recovered from the Flash Crash in early August, a revision showing a large decline could reignite fears of a hard landing and the Growth Scare that freaked out The Street 3 weeks ago.
If the market should react positively to today’s “revision” banking on one more good high with Jerry lighting up the Grand Tetons on Friday, I can’t help but think it will be a case of Cheech and Chong speeding down the highway with smoke coming out the windows of their V W bus oblivious to the highway patrol behind them.
In sum, this Friday will be the 42nd anniversary of the action Jackson Hole Fed junkets, the first one being in August 1982 when the greatest bull market in history began.
On my Square of 9 Wheel, 42 is 18i0 degrees straight across and opposite August 23rd.
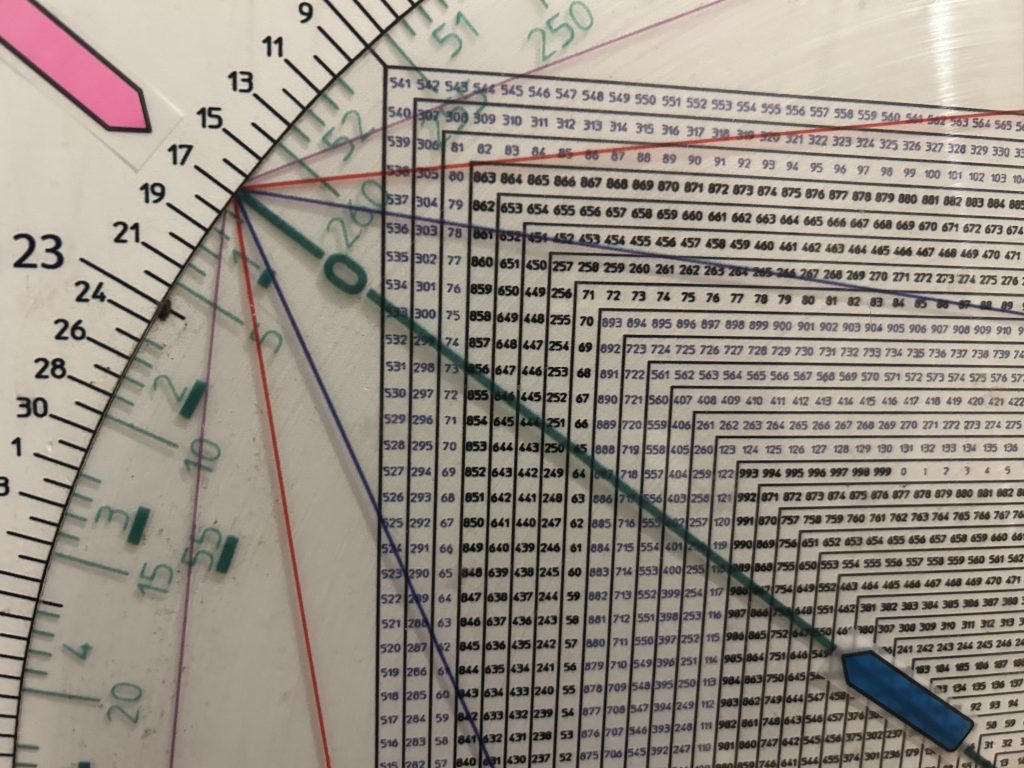
So there is some good synchronicity with this Fed Jackson Hole and the bottom of the bull.
Wil Friday market a Secondary High prior to a C Wave crescendo lower?
Checking a weekly SPX is illuminating.
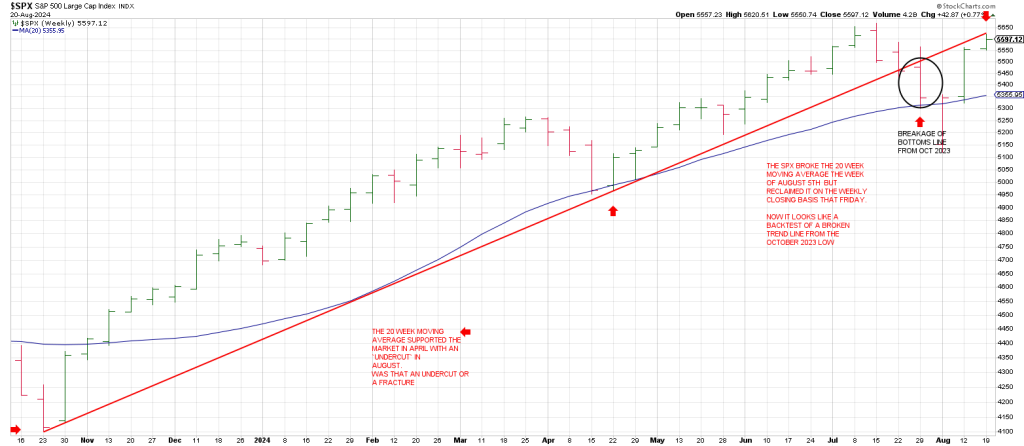
The SPX 20 week moving average acted as support in April.
It broke the 20 week on the week of April 5th but reclaimed it on the weekly closing basis.
A Bottoms Line connecting the October 2023 low and the April 2024 low was broken in late July and shows what may be a bearish backtest currently.
This is in the context of a weekly Minus One/Plus Two sell setup.
Breakage below the 20 week moving average is a Get Out Of Dodge sell signal.

Square of 9 Wheel
Purchase your own Square of 9 Wheel. Shipping to US only. Contact Jeff for shipping outside the US.