“in the paper today, takes of war and of waste
But you turn right over to the TV page.” Don’t Dream It’s Over, Crowed House
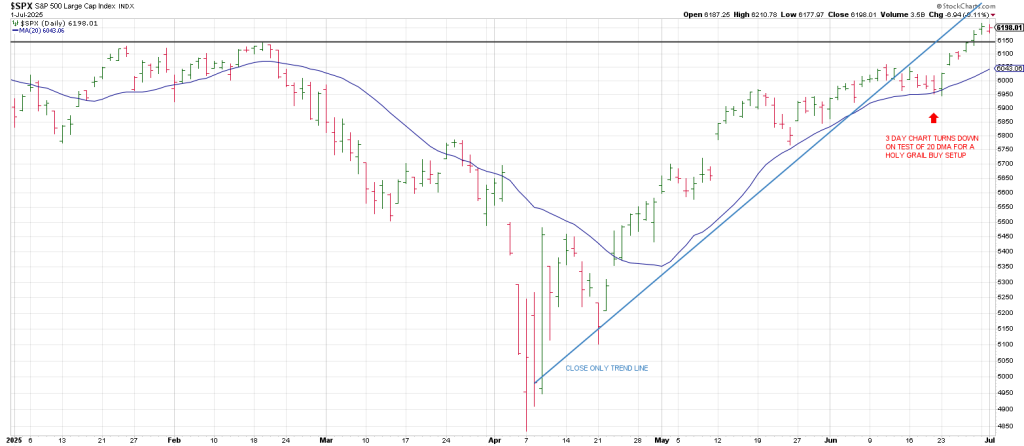
Markets struck a low the first week of Q2.
It was a Tractor Beam into the end of the quarter.
Of course not all quarters see window dressing markups on top of melt-ups.
There were two factors that produced this run for the roses:
1) There was a 1312 point 7 week waterfall into April 7th in keeping with the Gann Panic Cycle.
Consequently there was little overhead supply once the rally kicked in above a 50% retrace and the SPX 50 day line.
2) The 1300 point Tariff Tantrum lured many players to short the presumption of a bearish retrace. This simply threw more logs on the fire for the bulls.
There two factors taken together put the rally into overdrive the closer we got to June 30th quarter-end igniting a powerful cocktail of FOMO (Fear Of Missing Out) and FOGO (Fear Of Getting Out).
The closer we got to quarter-end without a pullback, fear set in with underinvested money managers trying to be discreet: Following the Breakaway Gap on June 24th after what we noted was another textbook turn down of the SPX 3 Day Chart and a Holy Grail buy signal on a test of the rising 20 day moving average.
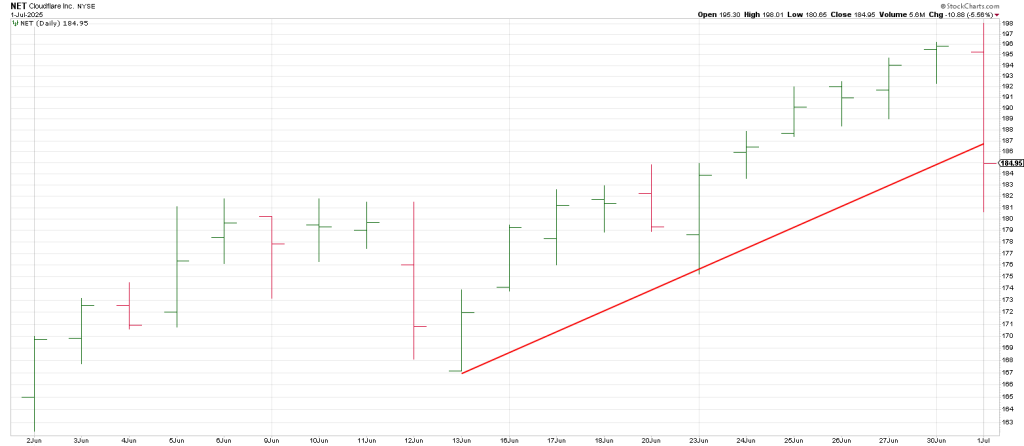
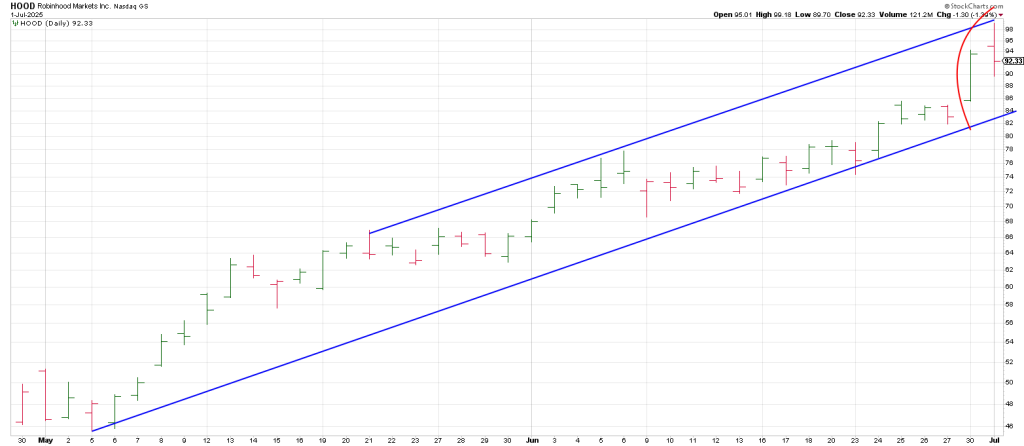
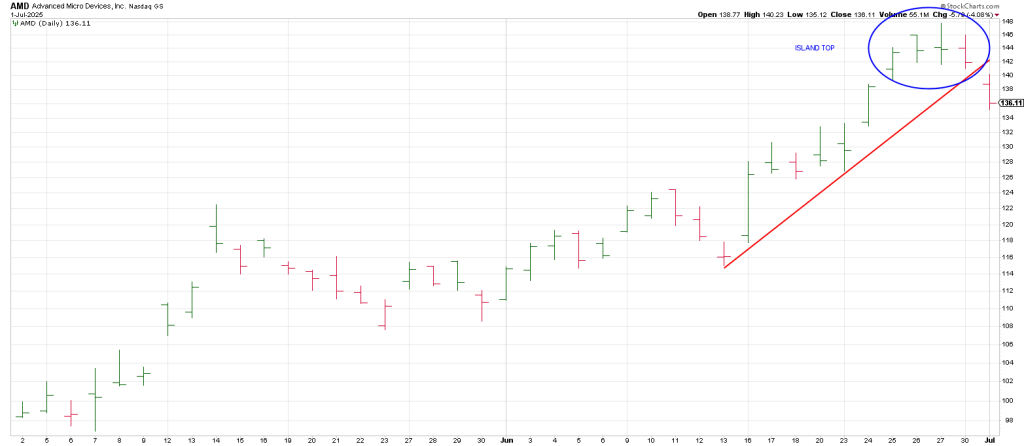
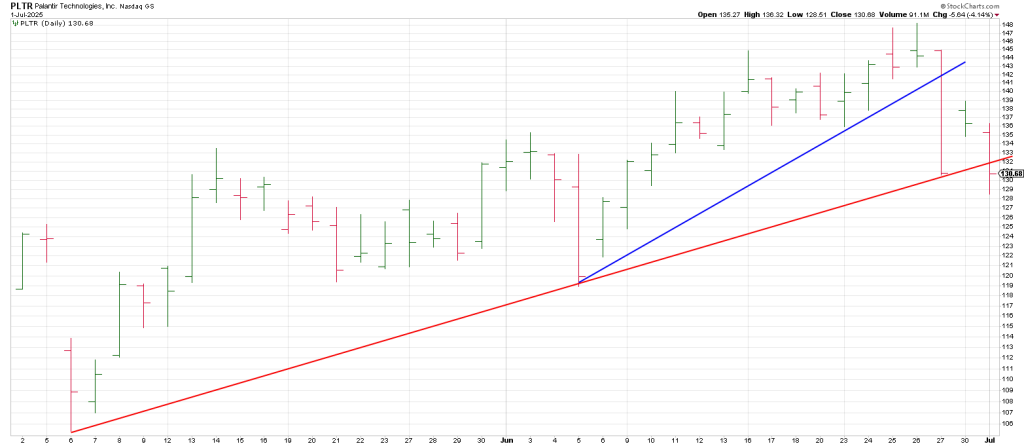
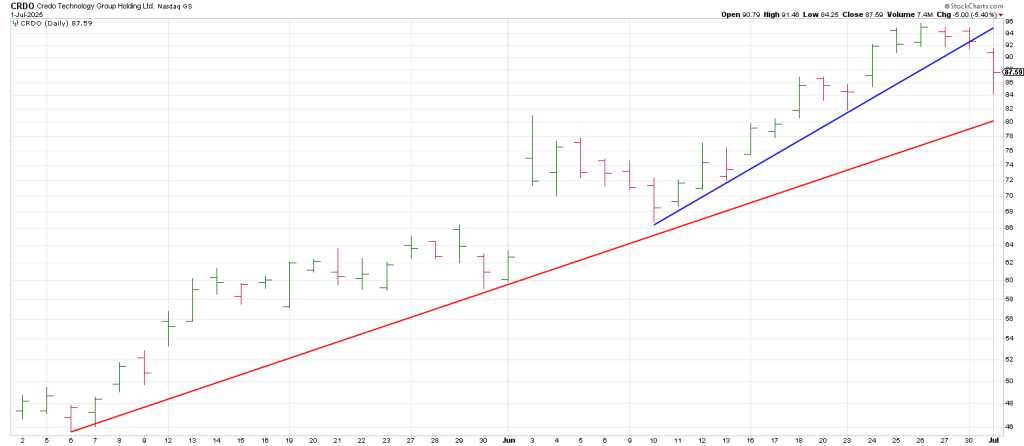
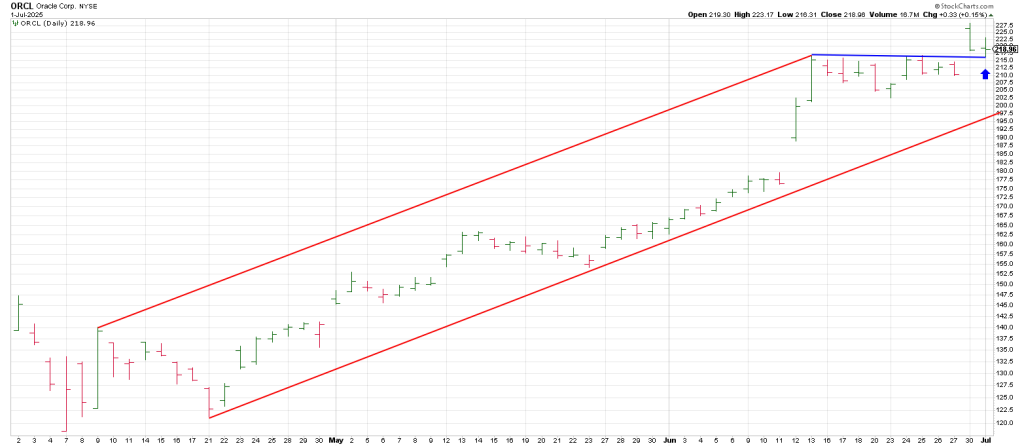
The Generals went parabolic.
Names include
NET
HOOD
AMD
PLTR
CRDO
And ORCL…to mention a few
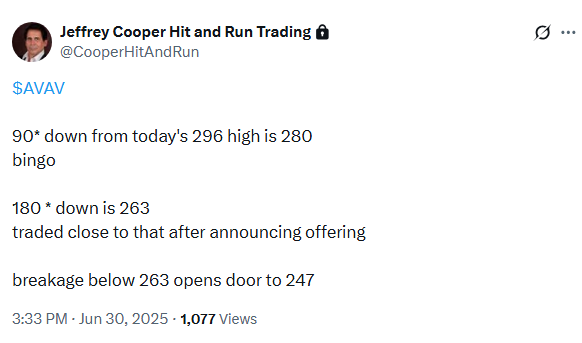
AVAV is another General that got shot courtesy of an offering. Some CEO’s actually act on “buying low and selling high.”
Late Monday with the stock at the 270 region, we alerted on the Hit and Run Private X/Twitter Feed that AVAV projected to 247 on the Sq of 9 Wheel.
It closed at 252 on Tuesday.

Square of 9 Wheel
Purchase your own Square of 9 Wheel. Shipping to US only. Contact Jeff for shipping outside the US.
In trading, I like to say INVERT.
Invert the chart.
When a stock is going vertical, and you turn the chart upside down, it’s easier to visualize a waterfall than it is gravity being defied.
Would you buy the above names…without a further correction?
If you turn their charts upside down you might think they present interesting buy opportunites.
That being the case, they may be stunning shorts…at least until the Q’s turn their 3 Day Chart down and test their 20 day moving average on a drop into Phil D Gap.
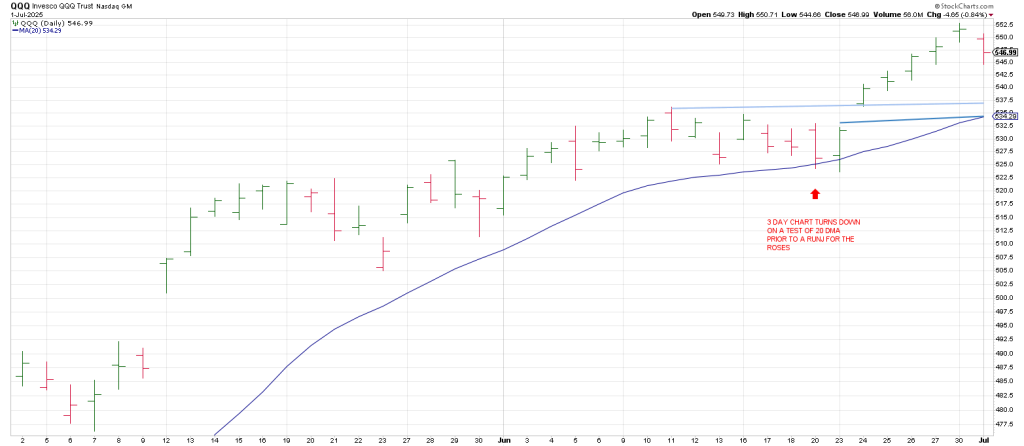
The Q’s struck a low of 402 on April 7.
360 degrees up is 485.
Another 90 degrees up is 507.
Another 90 degree decrement higher is 529.
The next 90 degree level higher is 553, Monday’s high.
The ramp into quarter end squared-out perfectly with 553.
Measuring from the April 7th 402 low, 553 is 7 squares of 90 degrees up.
Clearing 553 opens the door to 578.
The next step is to measure off TIME, April, 7th, the low.
April 7th squares out with 561 on July 7th,
July 7 is 90 DAYS/DEGREES from April 7.
If a textbook 90* correction from Monday’s peak is on the table it targets 529.
If another leg up erupts after a presumed pullback there is a projection for 561 around July 7th.
That said, the Q’s show a stealth Island top; a reversal below the February high with momentum opens the door to the possibility that a Bull Trap
Has been sprung.