For only the second time since the January 24th peak the SPX carved out two consecutive higher daily highs yesterday.
The first instance was March 17th.
As well Tuesday was an NR 7 Day, the narrowest range in 7 days.
In fact it was the narrowest range since the all-time high.
Typically these contractions in volatility see an expansion in volatility hit in the next few days.
Given that the last months volatility was the 2025 version of the pandemic meltdown, I can’t help but wonder what yesterday’s NR 7 Day portends.
The “Roadmap” indicates a rally in the first half of today’s session.
If so the SPX will turn its 3 Day Chart up for the first time since the February 19th all-time high.
If it’s a continuing bear market, then the turn up will define a high soon in terms of time and price.
Interestingly the Roadmap suggests a meaningful reversal following a turn up in the 3 Day Chart today.
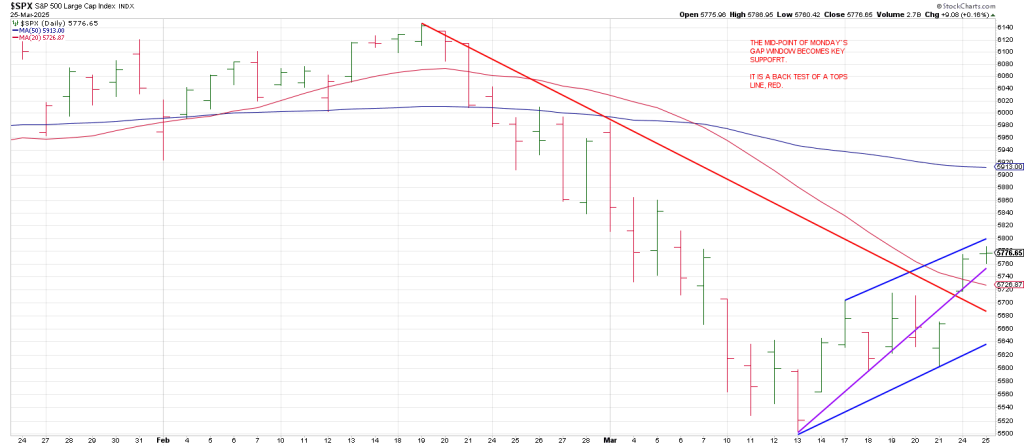
A reversal from the 5800 region ties to a 50% retrace and a 360 degree advance off the 5505 low on March 13th.
Additionally as flagged earlier this week a drive to 5800ish produces a Time/Price square-out as 581 (5810) squares-out with January 24th, the orthodox or Primary High (the February 19th peak was a short-lived, false breakout.
Talk about fast moves come from false moves.
So there is a strong likelihood if the 3 Day Chart turns up we get a reversal, especially if the SPX can satisfy a push to 5800-5810.
1) The angle of attack to the downside indicates the trend is down.
2) The declining 20 and 50 day moving averages indicate the trend is down.
3) The SPX is in the weekly Minus One/Plus Two sell position.
When the trend is down a turn up of the 3 Day Chart should find a low soon in terms of time and price—especially the first time it occurs after a strong break.
As well the contrast between Monday and Tuesday’s market action is revealing.
on Monday the DJIA surged 598 points and the SPX gained 100 points, fueled by deeply oversold conditions after the SPX fell 650 points over the prior 3 weeks.
Not surprisingly, Monday’s breadth reflected that sgtrength.
NYSE net advances finished at +1,318.
NAZ net advances finished at +1,523.
Tuesday, however, the tone shifted.
The DJIA added just 4 points and the SPX posted a 9 point gain.
But beneath the surface, the message was clear.
Market breadth turned sharply negative with -305 net declines on the NYSE and -1,007 decliners on the NAZ.
While it is not surprising to see a Pause Day after an Upthrust like Monday’s, with underlying breadth turning sour that quickly paints not so rosy a picture as the market taking a breath.
That said, The end of the quarter is approaching: Monday is March 31st.
The boyz did a good job of creating a Squeeze Play following Friday’s solid down open to paint the tape for quarter-end.
After all is said and done, it’s all about keeping assets under management.
The question is can they keep all the “doggies in the coral” or will some players break rank looking for a graceful exit?
In sum, while some cocktail table Gann enthusiasts may think the coast is clear and that the Gann Panic window is in the rear view mirror, in truth, counting from the February 19th all-time high the next 3 weeks has the potential to be a doozy.