
Below is a SPX monthly going back to the 2000 Internet Bubble Top.
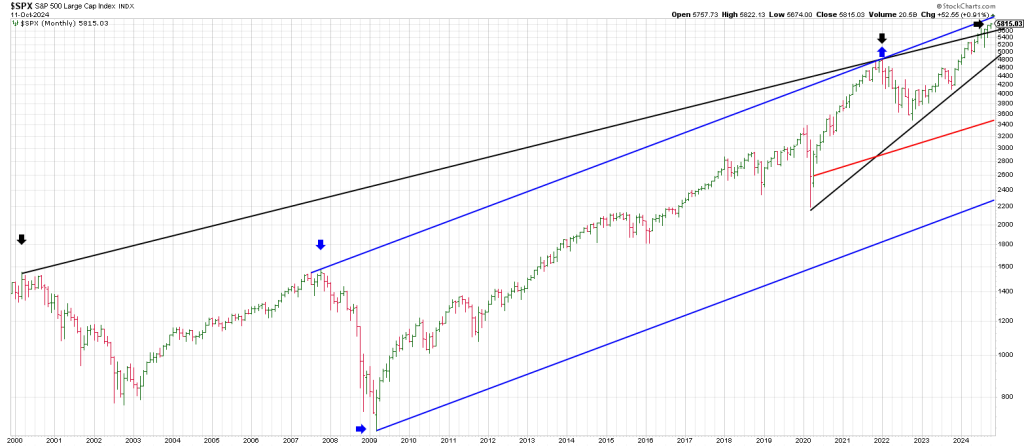
As you can see since the 2009 bear market low, the largest correction occurred in 2020.
It overbalanced any prior correction in price since the 2009 low.
From the March 2020 crash low the SPX saw a vertical advance into late November 22nd 2021 thru January 4th, 2022 “pattern high”.
The decline from early January 2022 overbalanced in Time any other correction since the 2009 bottom.
In other words the decline in 2022 was the largest drawdown in Time since the bull market started in March 2009.
This concept of ‘overbalance’ is something W.D. Gann believed was an important factor in determining the trend. It tells market participants that you are in the last phase or section of an advance.
While the market has rallied for two years since the October 2022 low, this must be considered as part of a 15 year run-up. 2 years in the context of a 15 year run is a relatively small percentage.
So this last 2 years may indeed be a final phase.
The bottom line is we have an overbalance in both time and price..
Consequently I connected the March 2000 top with the Nov 2021/Jan 2022 top (black tops line).
The SPX struck this trend line in July 2024.
The convergence exerted its downside influence with a Flash Crash in early August.
Subsequently the SPX has recaptured this Tops Line. Marginally.
A reversal back below the trend line is another warning shot over the bow that this 4th and final phase (as shown last week) may be complete.
I also created a Tops Line (blue) that connects the 2007 top with the January 2022 top.
Perhaps the SPX has a date with destiny somewhat higher in this time frame.
I paralleled a line from the 2009 low with the blue Tops Line from 2007. It ties to the 2300 level over coming months. Essentially a test of the Covid Crash lows.
The red trend line parallels the Covid MONTHLY closing low with the black Tops Line.
As you can see it ties to the 3490 region, the major low in October 2022.
The black Bottoms line on the chart is the bottom of a Rising Wedge starting from the Covid low.
It ties to the 4800 region.
Look the geometry in the relationship of all these highs and lows:
- The Bottom of the Rising Wedge ties to the January 2022 top.
- The red line connecting the monthly Covid Crash low in March 2020 paralleling the black Tops Line ties to the 3490 October 202 low
- The bottom rail of the blue trend channel points to the Covid Crash low.
The question is does the SPX push higher to kiss the top rail of the blue trend channel in the upper 5800 region?
We are in the time window for a turning point as well depicted by weekly SPX below.
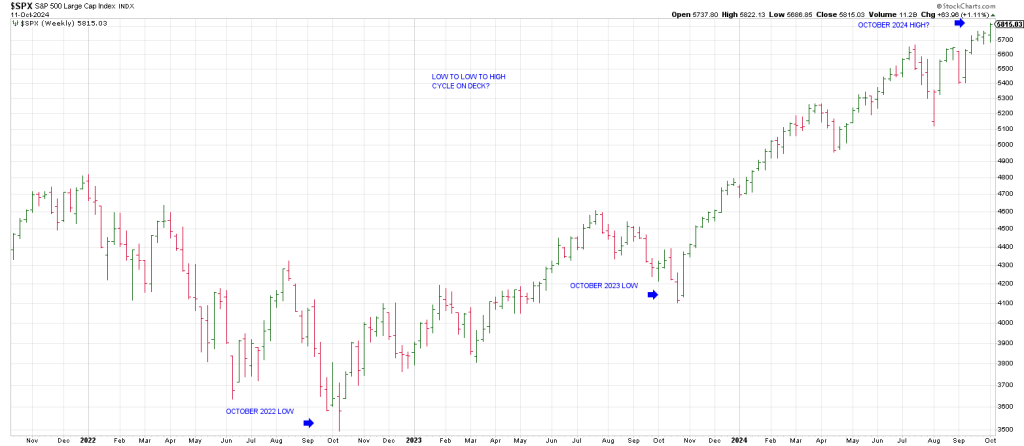
October 2024 satisfies a Low to Low to High Cycle.
We have a 1 year ow from Oct 2022 to Oct 2023 and are 1 year from the Oct 2023 low.
We also have a larger 55 month possible Low to Low to High Cycle on the table.
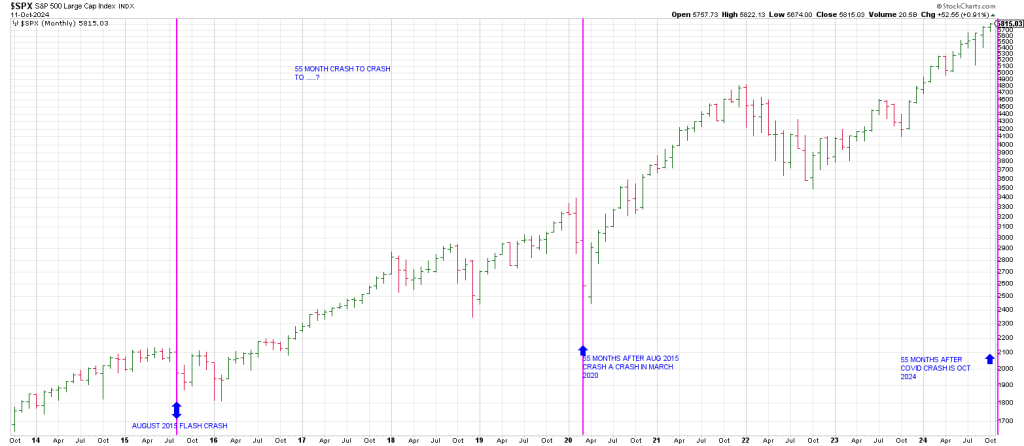
From the August 2015 low to the March 2020 low is 55 months.
Adding 55 months to the March 2020 low you get October 2024.
55 is also the 9th number in the Fibonacci series.
9 is the highest single-digit number. It is also the last number in the first square in the Square of 9 Wheel.
55 is also the end of the Gann Panic Zone.
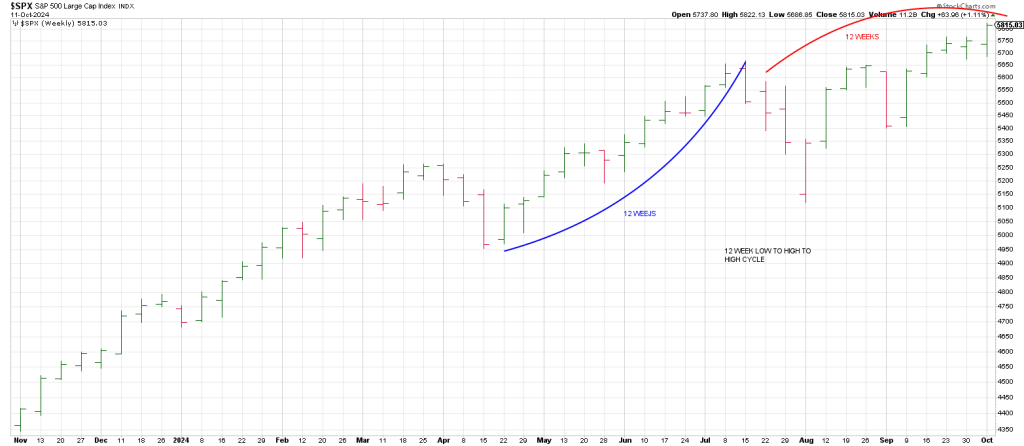
October also satisfies a possible Low to High to High Cycle.
It is 12 weeks from the April 2024 low to the July 2024 high.
12 weeks from the July 2024 peak gives the week of October 7th, last week.
There is another major cycle potentially poised to exert its downside influence.
The 50 Year Jubilee Cycle shows a low to low to possible high pattern.
It is 50 years from the Great Depression low in the summer of 1932 to the major bear market low in the summer of 1982.
Adding 50 years to the major bear market low in October 1974 gives October 2024.
In sum, it was a powerful come-back week for many momentum stocks.
Hit and Run plays included CRWD for an OpEx Pinball move from the 310/ 311 region on Thursday looking for the 320 strike.
APP extended from 140 on track for our 149 projection from last week.
ANF was a long OpEx Pinball play from 145 to the 150 strike for us.
It’s poised for continuation to 150 into Phil D Gap.
VST hit our 115 (114.50 to be precise) square-out level on the Square of 9 Wheel (in tandem with the 20 day ma) on Friday morning exploding to the 125 strike. Another OpEx Pinball setup.
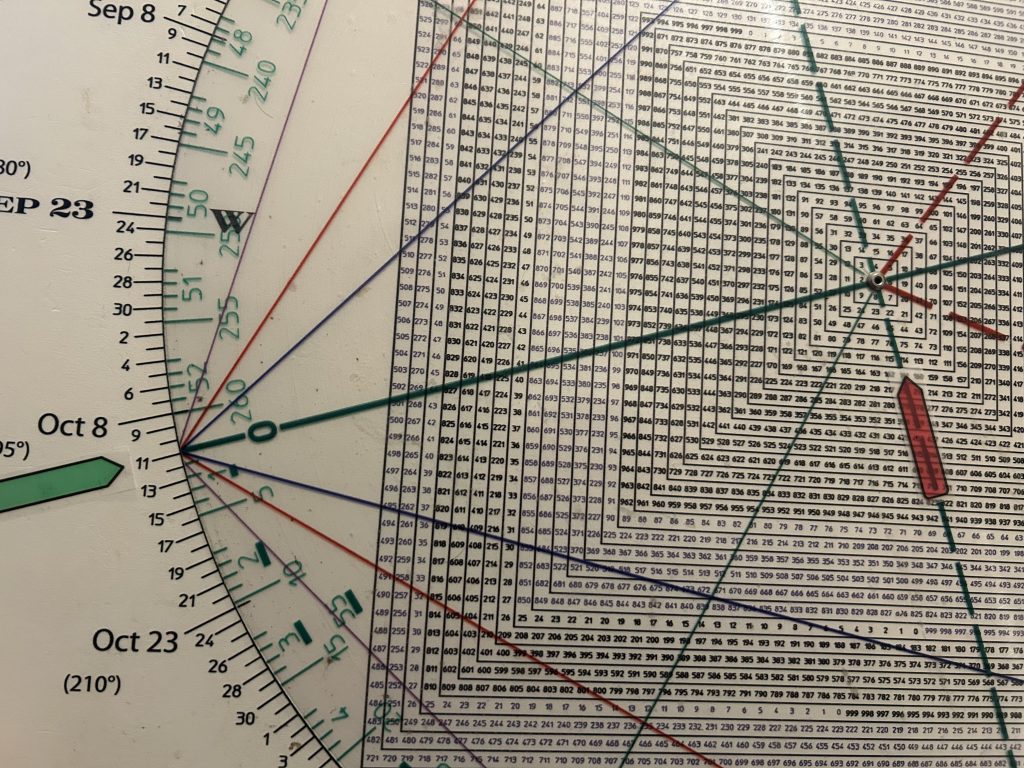
114.50 red, squares-out with October 11, Friday
COHR flagged on the Hit and Run Private Twitter Feed to come out of a Bull Flag before Friday’s open shot up towards the 105 strike after gaping open above the 100 strike.
TEAM flagged several times last week stopped us out just before exploding 22 points in 3 sessions.
It will be interesting to see how it handles following it’s 3 Day Rule spike and leaving a Lizard sell signal on Friday.
GDXJ exploded after testing its 50 day line on Wednesday after turning its 3 Day Chart down for the first time since the September high and we went long GDXU from 41.25.
I’ve lost track of how many swing long trades we’ve had in the last 6 months alone but we’ve racked up much more in gains than GDXU itself is trading at currently.
Checking a weekly SPX from January 2022 shows this is a key week.
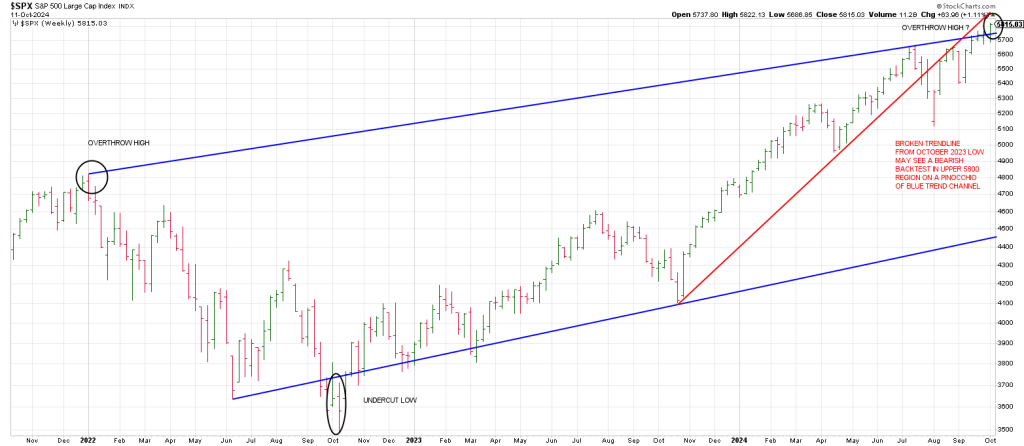
I created a trendline from the June 2022 Primary Low which shows how the Oct 2022 low was an Undercut Low, a Secondary Low.
I then paralleled a trend line off the January 2022 peak.
Again, notice how strongly the top rail of this channel rejected price this past July.
Notice how the SPX pushed above the top of this channel last week. Is the SPX working on a Throw-Over mirroring the October 2022 bottom?
Notice how this 5800 region satisfies a bearish backtest of the red trend line from 2023.
In other words the trend from the big Oct 2023 low was broken with authority.
The ‘first break’ has produced a squeeze back to the top of the red trend line.
As I say, “The first mouse gets the squeeze, the second mouse gets the cheese.
The next break of trend, a break below a rising trend line from the August 5th low which ties to 5700, gets the cheese—the bear cheese.
In addition to the aforesaid synchronicities showcased for an October turning point, we are 90 days/degrees square from the July 16th peak.
583/584 (5830-40) is square the July 16th peak and straight across and opposite October 15th producing a possible Time/Price square-out.
How do you say Turnaround Tuesday in Bear speak?

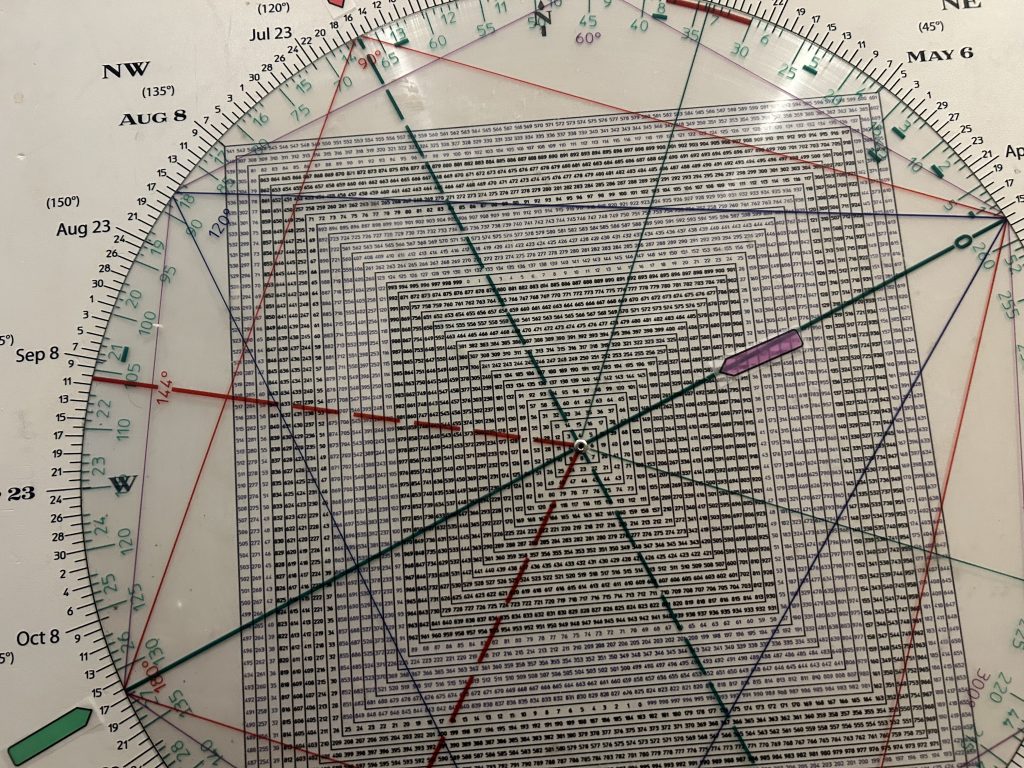
Square of 9 Wheel
Purchase your own Square of 9 Wheel. Shipping to US only. Contact Jeff for shipping outside the US.