“I was born in a crossfire hurricane.” Jumpin’ Jack Flash, The Rolling Stones
Welcome to the breakfast show.
On Tuesday August 6, the SPX turned around after a Flash Crash wherein the index dropped from 5565 to 5119 in 3 days, a 446 point, 8% swan dive in just 3 days.
That low produced a 90 day 900 point blow-off.
The Seer, W.D. Gann would have loved the synergy of 90 days and 900 points as he claimed that the secret to his success was that the stock market, like everything else in creation responds to what he called the Law of Vibration.
Gann said that he learned about the Law of Vibration, a principle of absolute mathematical harmony, by reading the Bible from cover to cover.
In short, the mind of the market is math.
Time and Price play out in 90 degree decrements like the natural seasons that divide the 360 degree
Year into 4.
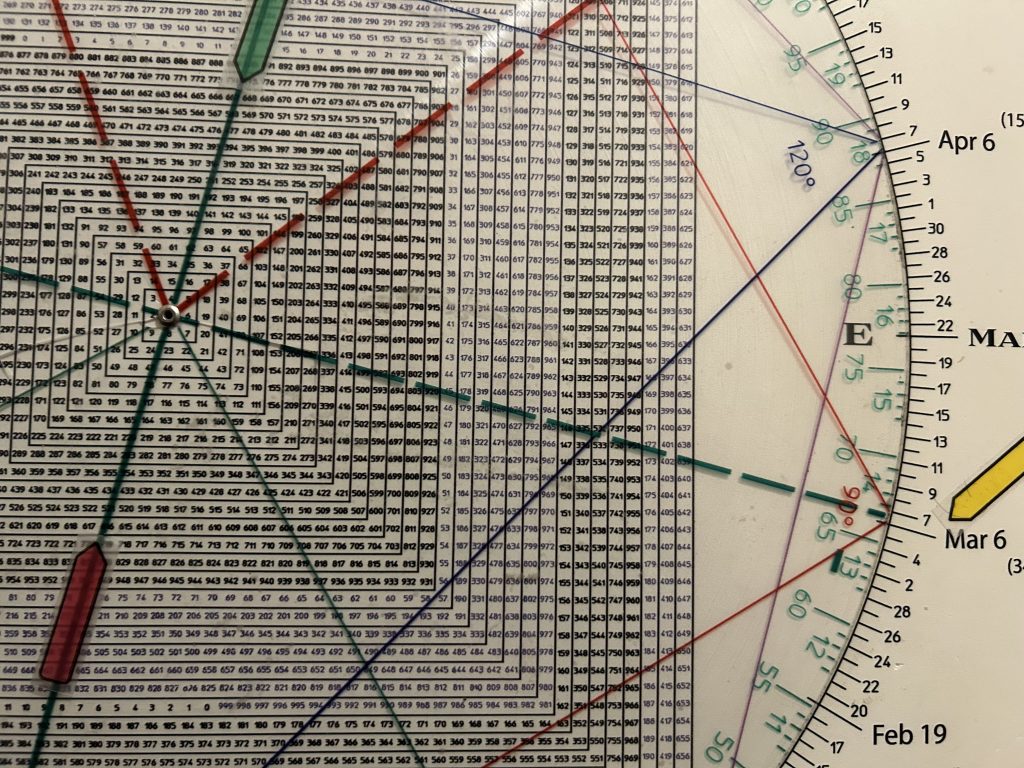
My Square of 9 Wheel pictured below is based on “9”.

Square of 9 Wheel
Purchase your own Square of 9 Wheel. Shipping to US only. Contact Jeff for shipping outside the US.
The first square in the number grid ends with the number 9.
The number “9” is considered the “last” number as it is the highest single digit number in the standard counting system.
When you reach 9, the next number 10, starts a new “decade” of counting
The Square of 9 solves the age old riddle of how to square the circle.
This is because the next “full square” up from the number 9 as you can see, is the number 25.
25 is a full “rung” of 360 degrees around and one full “square”.
Time and Price are not linear they move in a logarithmic or square/square-root natural progression.
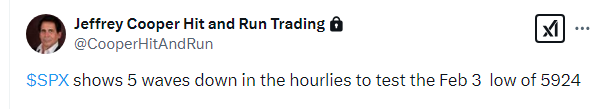
This is one of the factors in our stating on the Hit and Run Private Twitter Feed yesterday, that the SPX should make a low on an undercut of the 5924 Feb 3 low.
Counting down from the 6147 all-time high we get the following 90 degree decrements down:
90 degrees down is 6068
180 degrees down is 5990
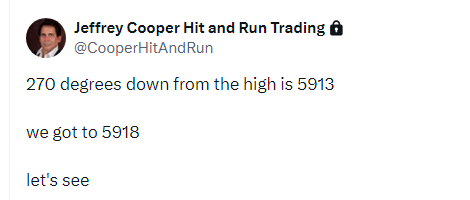
270 degrees down is the aforesaid 5913
360 degrees down is 5837
The SPX undercut 5913 hitting a low of 5908 Tuesday briefly before reversing with authority.
450 degrees down is 5761. Notice how this ties to the low for the year—the January 13, 5774 low.
A key 540 degrees down at 5685 cubes out the high. In other words 5685 is a cube, a true square of 540 degrees down from the all-time high.
This ties to the summer highs. It is what I’m calling the Maginot Line for the bull.
Counting up from the key 5119 August 5, 2024 low we get 5557 as 540 degrees or a cube up.
Two cubes up of 1080 degrees from the August 5 low is 6014.
The all-time 6147 high on Feb 18, is just shy of a 180 degree Throw-Over from 6014.
(1 180 degree Throw-Over would have been satisfied at 6170.
This is a significant level as it is straight across and opposite 667, the 2009 low.
As well it squares March 6, the day of the 2009 low.
Is it possible that the SPX pushes to a new high to 6170 ish.
Anything is possible in markets. Our job is to identify what’s probable.
As long as the SPX remains below 5990, which is 180 degrees down from high, the pressure remains down. This ties to the overhead 50 day moving average which is rolling over now at 6007.
So this is the band we’re watching: 5990 to 6007
Interestingly the overhead 20 day moving average is currently at 6059 which is 90 degrees down from the all-time high.
In my experience when you find these square-outs dove-tailing with important moving averages such as the 20, 50 and 200 day moving averages, you’ve got something.
But I digress. We want to show how we pinpointed yesterday’s low noting that the index had room to run to the 6100 region.
The SPY is indicating the market will open near 5980 this morning.
As offered above, 270 degrees down from high is 5913.
A 10 minute SPX shows 3 drives down from the all time to Tuesday’s low of 5908.
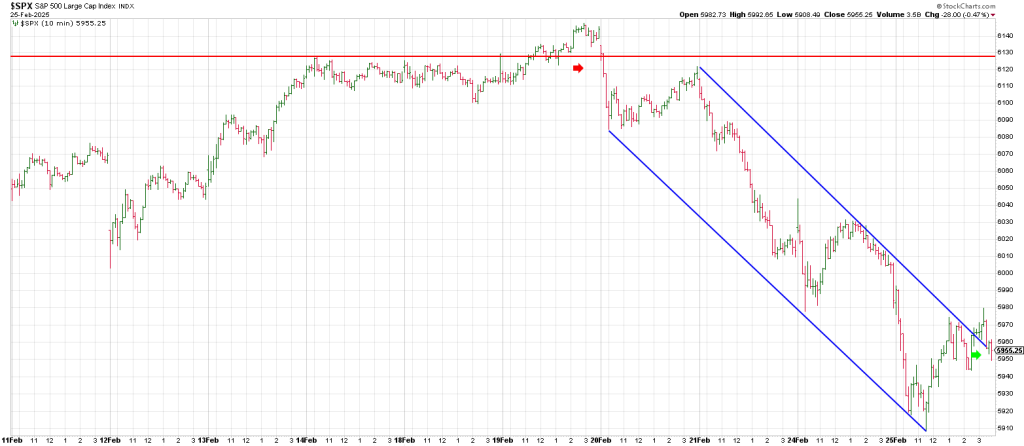
Notice how quickly the SPX “got up off the floor” when it probed 5919.
As well the low bar undercut the prior low 1 hour earlier leaving a micro Bear Trap.
Notice how once the Undercut & Rally pattern played out the SPX ran to the top rail of the declining trend channel.
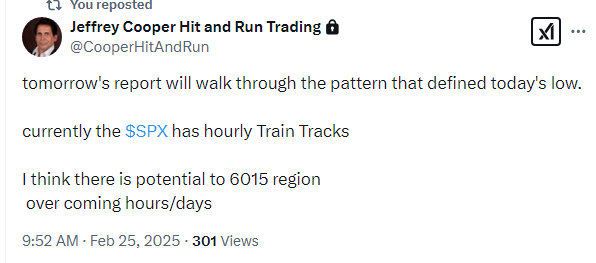
An hourly SPX shows the 5 Wave decline to Tuesday’s square-out.
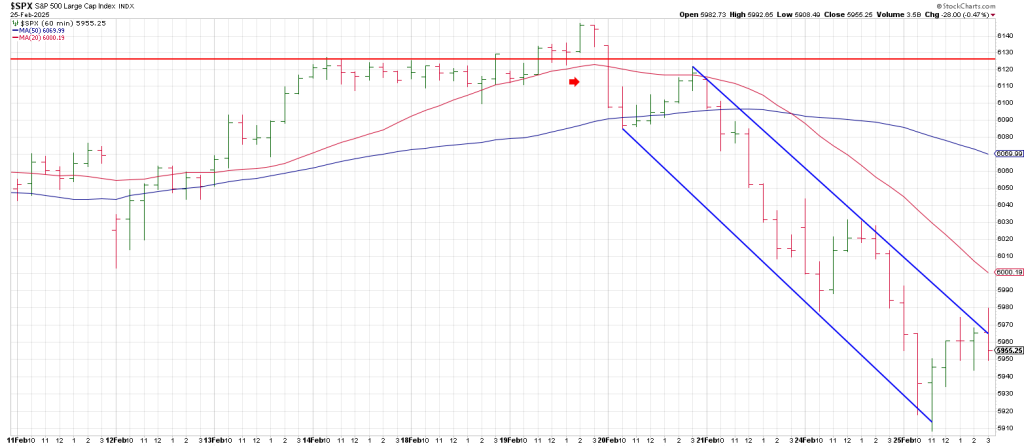
Notice the false breakout from the high level consolidation that nailed the top on February 19th.
When the SPX Jackknifed back below the Line Formation (high—level consolidation) the market buckled: false moves lead to fast moves.
In sum, Turnaround Tuesday followed a turn down of the SPX 3 Day Chart on Monday and a dive below the important 50 dma.
Each of the 4 instances since the December peak when the SPX dropped below the 50 day moving average, it has been able to rally to reclaim the 50 day line.
Whether it can do so once again will in large part depend on the Streets reaction to NVDA.
However what if they deliver the goods, and the Street doesn’t care?
Jensen has the whole world in his hands today. Can NVDA heal what’s ailing the market and tech in particular?
Sure the market can rally — perhaps big. That’s what bear market rallies are notorious for.
The news breaks with the cycles, not the other way around, and the cycles I’m looking at point down particularly in March.
March is 7 months from the early August Flash Crash.
W. D. Gann wrote that 7 is the number of panic.
Will we see something more than a ‘flash’ in March?
This March is 4 squared years from the March 2009 bear market low.
This March is 5 squared years from the March 2000 bubble top.
Time Price and Pattern imply…
Beware the Ides