“The coming lunar eclipse is a lunar return of the 1987 crash. The next lunar eclipse will activate astro from 1987 and 2008.”
I received the above in an email on Monday.
The next lunar eclipse is Friday March 14.
As it happens Friday is the 49th calendar day from the Primary High, January 24th, 2025.
This is the heart of the Gann Panic Zone which ties to 7 squared days from high, 7 being the number of Time and panic.
The heart of the Gann Panic Zone runs from the 49th day to the 55th day.
In other words from the 7th week until the 8th week from high is when capitulation and a Selling Climax may occur.
The two most infamous examples of this pattern are 1929 and 1987.
As soon as the market slipped below its 200 day moving average accelerated momentum to the downside showed up.
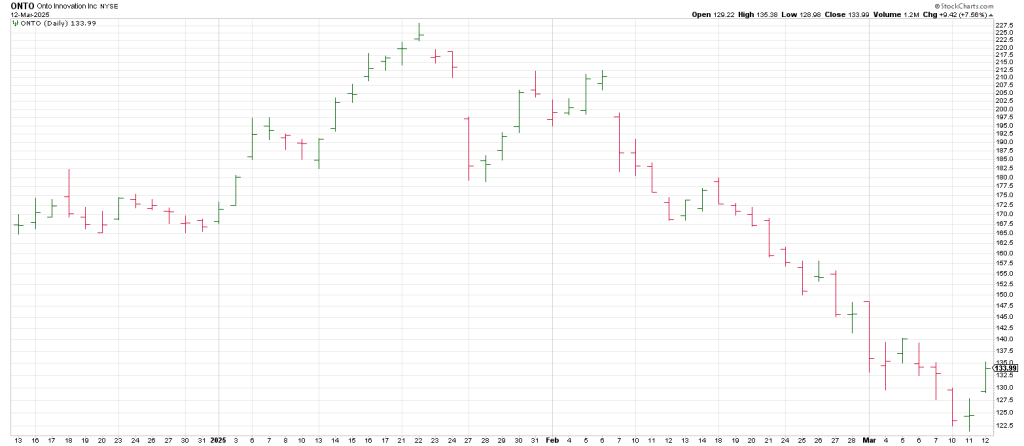
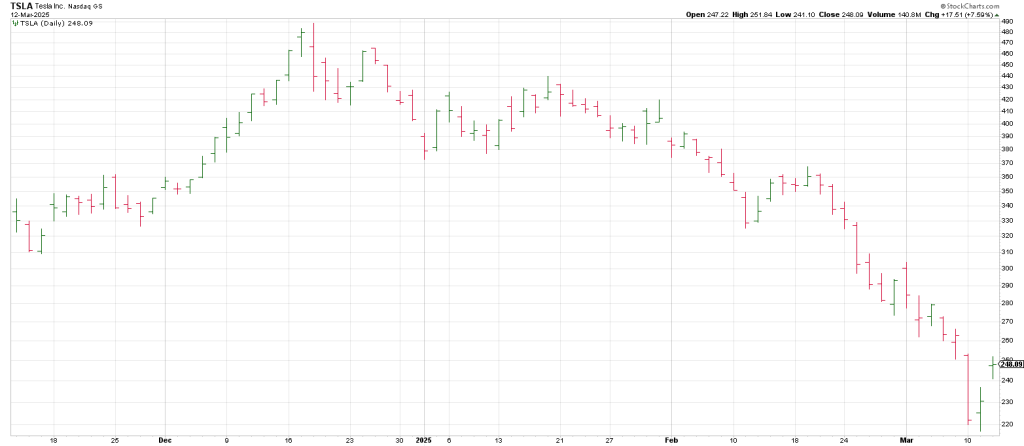
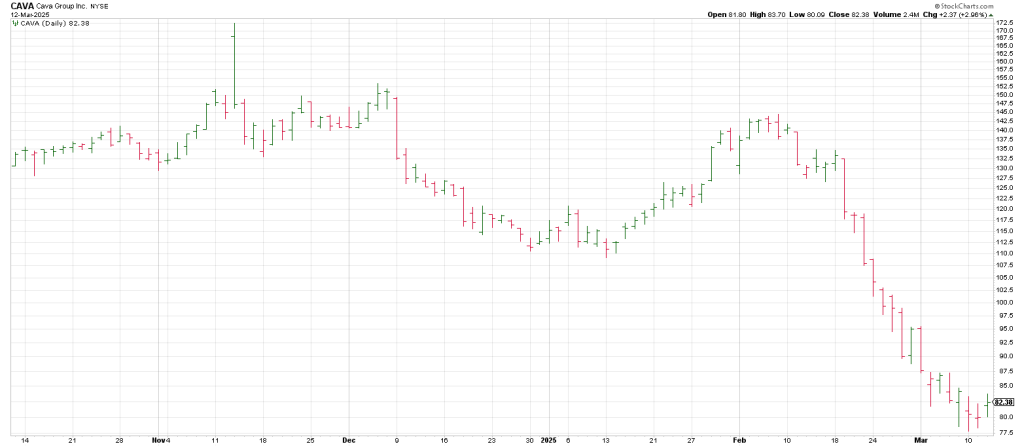
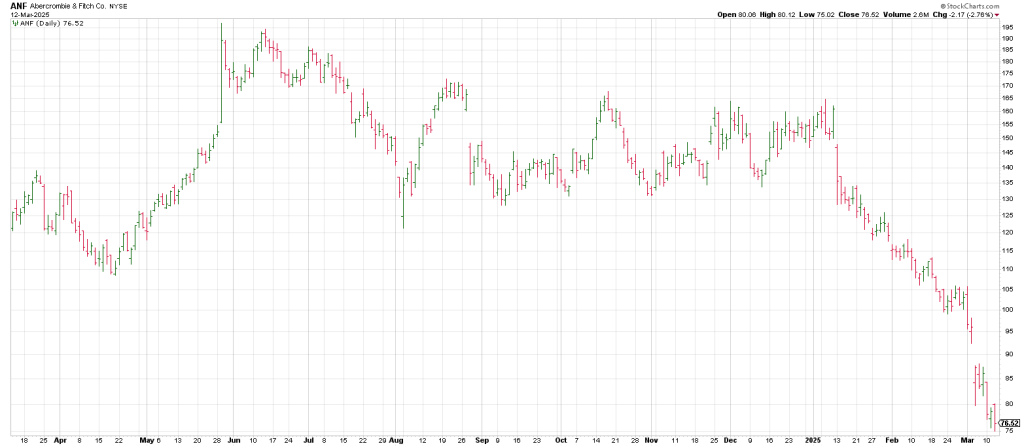
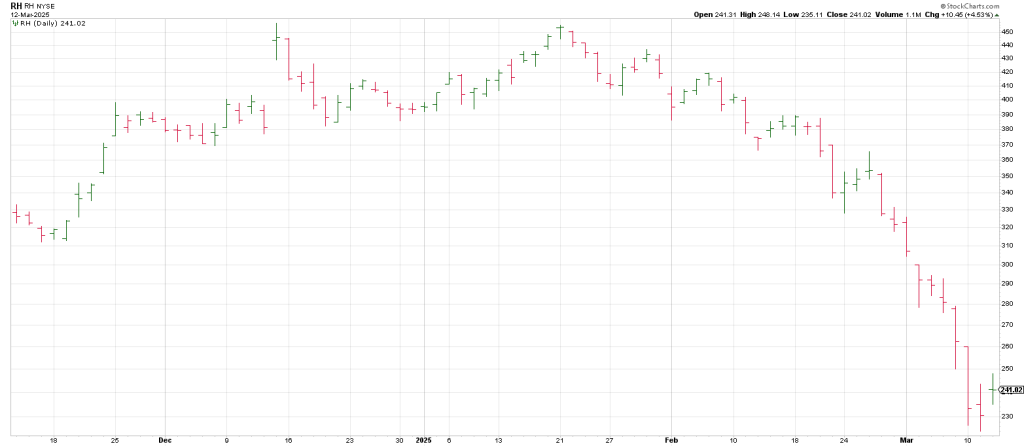
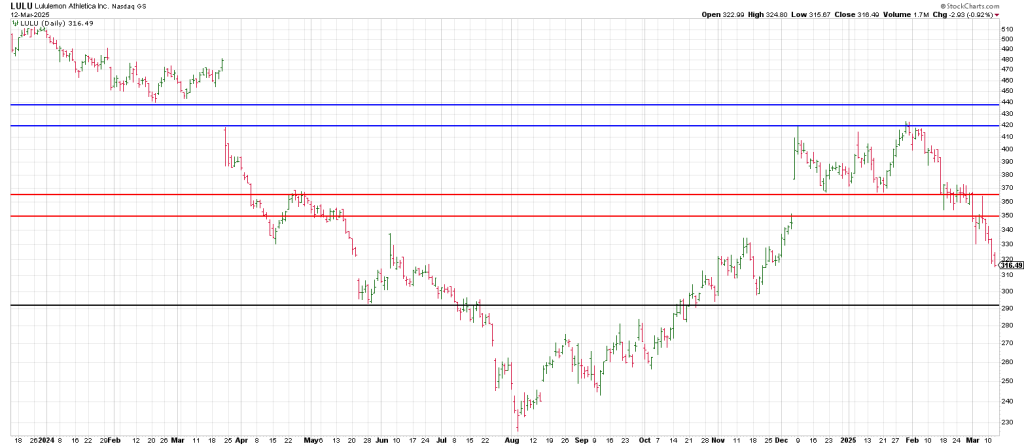
The thing is many stocks have already crashed. It’s hard to fathom what these stocks will do if the broad market toboggans from here.
A few examples
The charts below shows what happened during the lunar eclipses in 1987 and 2008
The charts below are weekly charts on the SPX.
The red arrows are when the lunar eclipses occurred.
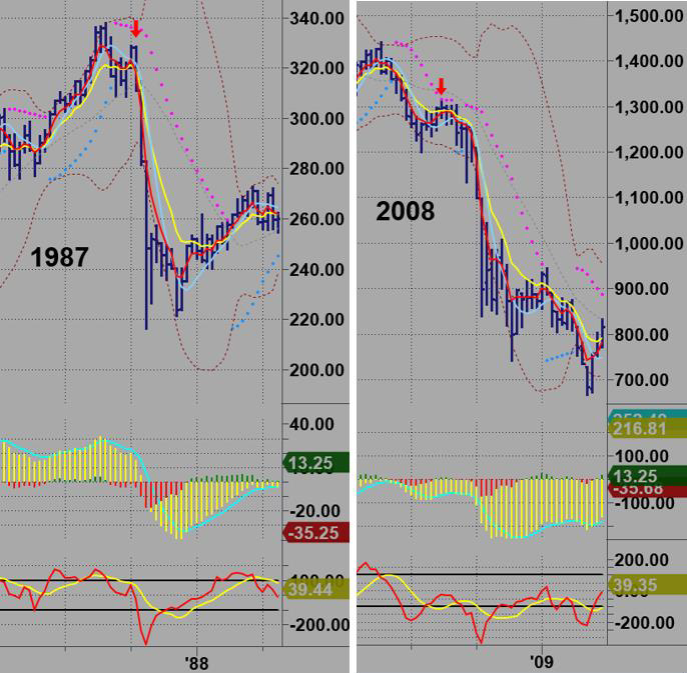
In 1987 the market dropped from 328 to 216 in 10 trading weeks (-34%).
In 2008, the market stayed up for two weeks and then fell.
After 8 weeks, it had gone from 1313 to 839 (-36%)
The market continued to fall until the March 2009 low.
In 1929 there was a solar eclipse on November 1st, just after the 3 late October crashes.
Interestingly, the low in 1929 was on November 13th, two weeks after the solar eclipse.
In 1987 there was a lunar eclipse on October 6th, two weeks prior to the crash.
Earlier this year we showed the examples of when Venus went retrograde this century.
Many were direct hits for turning points, either up or down.
In mid-June we have a Jupiter/Saturn square.
Mid-March is 90 degrees square mid-June.
Crashes are the short straw, but if one is going to play out, this is where it would occur.
The SPX saw a huge gap open on Wednesday but immediately reversed going red by around 25 points before rebounding to the region where it gapped open at 5626.
The index tested that 5625 region three times yesterday leaving a trading band from 5590 to 5625 in front of today’s PPI.
The report could be a catalyst for a micro Rule of 4 Breakout to the topside or downside.
In sum, the SPX is in a precarious position.
Ever since knifing through its 50 DMA when it turned its 3 Day Chart down on Feb 24, each time the dailies have turned up on trade above the prior day’s high it has defined an immediate high.
We have the same pattern on Wednesday. The SPX traded fractionally above Tuesday’s high on the open and nose-dived.
This is the spot in the cycle where the wheels come off if they are going to.
Two 540 degree price cycles down from high is 5242.
This ties to the high of the low bar day of the Flash Crash into August 5th.
If the market wants to emulate 1929 or 1987 it will drop to 4800 ish, the January 2022 peak.
That’s 800 SPX points or roughly 14% from Wednesday’s close.
If there is a massive margin call playing out anything is possible.
And the Margin Man may be making the rounds: AAPL is getting hammered because it is a source of funds,
As such, breakage this week below the Neckline of a weekly Head and Shoulders projects to the 200 region.