“There she goes again
She’s out on the streets again” There She Goes Again, The Velvet Underground
While at one point the SPX had fallen more than 10% during April, the index finished the month down just -0.76% leaving a massive monthly bottoming tail.
In short, the SPX plunged off its February peak and surged of an early April low leaving a “V Bottom”—for the moment…IF it sticks.
Not all “V’s” are created equal as Sir Winston Churchill knew.

Not even the Covid Crash in 2020 saw this kind of a dramatic one month reversal off its March low
As well there was a major monthly reversal in March 2022 following the initial downdraft off the January 2022 top.
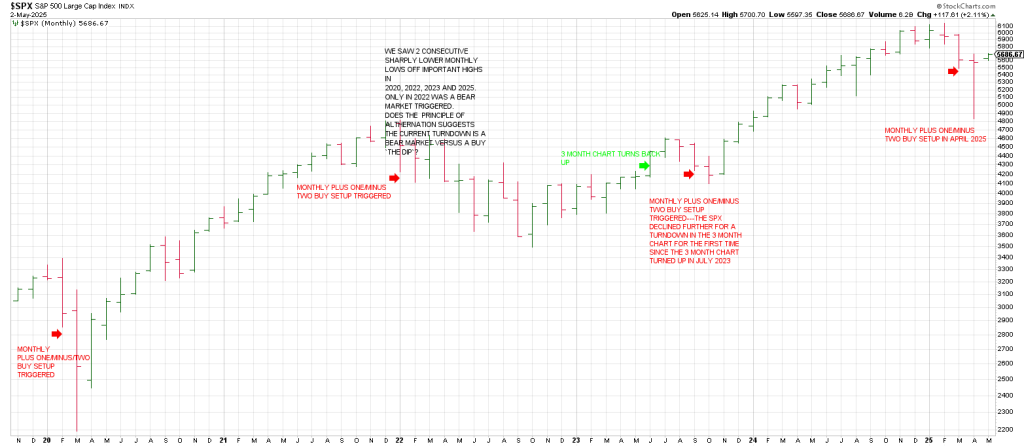
What these drops had in common was that they each followed monthly Plus One/Minus Two buy setups.
In other words, in each instance the 3 Month Chart was pointing up (Plus One) while the ‘sell-off’ traced out 2 consecutive lower monthly lows (Minus Two).
There is no cut and dried conclusion to draw from this big picture monthly setup.
For example in 2020 the Monthly Plus One/Minus Two led to a more than 100% advance in 21 months.
However, notably, the SPX went into the “position” with the second monthly lower low at 2855.83 in the midst of a plunge to 2191.
We have to remember that we are using Time-based-Price.
In 2022 the SPX carved out a Monthly Plus One/Minus Two buy setup in February that produced bullish looking monthly Train Tracks (Feb was straight down, March was straight up).
However there was no follow thru as in the spring of 2020.
The SPX rolled over, ultimately dropping into October.
Notably when the low of the monthly Plus One/Minus Two buy setup was breached, the SPX accelerated to the downside. This was on trade below 4116 in May 2022 on the way to 3491 in Oct 2022.
Now once again in 2025, at the start of the year, the SPX has carved out 2 consecutive lower monthly lows while the 3 Month Chart is pointing up producing a Monthly Plus 1/Minus 2 buy SETUP.
Of course it appears easier than was the reality.
Allow me to explain.
The SPX WENT INTO THE monthly +1/-2 buy POSITION when it satisfied 2 consecutive lower monthly lows.
This occurred on trade below the March low of 5488.73.
The SPX skidded another 653 points into April 7th before the +1/-2 got any ‘teeth’.
In sum, there clearly was nothing automatic about the setup.
Which is why I say these setups go into the POSITION.
It is the ensuing behavior once an item goes into the position that tells the tale of the tape.
You have to use multiple time frame analysis to determine WHEN the MONTHLY setup is or is not a buy.
You have to go to the weeklies and dailies.
I can’t help but wonder if the Rule of Alternation will play out with the current Plus One/Minus Two buy setup producing a bear market as it did in 2022 versus 2020 (and 2023’s turndown in the 3 Month Chart) that produced new up legs.
Indeed if one had taken the Monthly Plus One/Minus Two buy setup as an outright buy signal as soon as it triggered, they would have had many a sleepless night unless they had used a tight stop.
Had one taken the setup on April 3rd (the day the SPX broke below the March low) at the 5488 region they were even as of April 24th and if still long would be up roughly 198 SPX points.
BUT the drawdown while waiting for the 198 point win was 653 points.
Not the optimal trading parameters.
In sum, the normal expectation is for at least a knee jerk reaction following a monthly +1/-2 buy setup and especially 3 consecutive lower monthly lows (which is a rare bird)..regardless of whether in the midst of a new bear or an old bull.
For example the SPX 3 Month Chart did not turn down in the GFC until November 2008, the Primary Low (March 2009 was the Secondary Low).
This is why we are at a unique point of recognition as to whether this is a knee-jerk rally in a bear
How do we use this monthly big picture setup?
It depends on the behavior coming out of the setup.
It depends on The Cycle and The Structure.
Which brings me to a discussion of the big picture structure and the 90 + year cycle
Below is a monthly DJIA from 1929 with a series of trend channels.
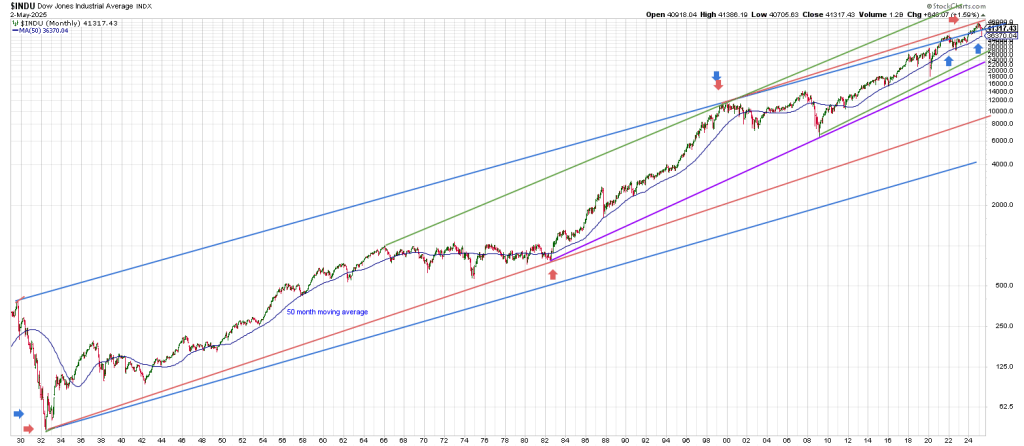
The blue trend channel connects the 1929 top with the 2000 top—roughly 70 years later.
W D Gann stated 7 is the number of panic and clearly the NAZ collapse from 2000 mirrored the DJIA collapse from 1929.
The DJIA bottomed 34 months from its September 1929 top—in July 1932
The NAZ bottomed 31 months from its March 2000 top—in October 2002.
Interestingly both years ending in “2”.
Extending the blue Tops Line past 2000 hits the January 2022 peak.
In fact it Pinocchio’s the line before turning down with authority.
In late 2024 the DJIA pushed above the Tops Line but relinquished it with authority in April before rallying back
To kiss “the line”.
So we have a 3 point trend line from 1929 to the Jan 5th 2022 peak, a period of 92 years 4 months or 1108 months.
Sometimes you get a 4th section as Gann wrote. The advance into Jan 2025 may be that 4th section.
An interesting juncture for sure.
Notice that the bottom of the blue trend channel ties to the 4000 region in over coming years.
The bottom of the red trend channel connects the 1932 low with the 1982 low.
The two most important lows of the last 100 years plus.
These are years ending in “2”.
I paralleled the red Bottoms Line off the most important peak in the last 25 years…the 2000 top.
Importantly, while the DJIA Pinocchio’d and seemingly broke out above the top of the blue trend channel in 2024,
It was solidly rejected by the top of the red trend channel in January/February 2025.
Consequently as bullish as this 9 day momentum streak may look, caution is warranted at this backtest of the top of the blue 90 + Year Cycle Line.
I think this rejection from the top of the red trend channel is a big deal…especially as it sent the DJIA back below the top of the blue trend channel.
Think about it. The bottom rail of the red channel connects the 2 most important lows in 100 + years.
It would be fitting for the top rail of the red channel to define a major high (early 2025) in tandem with the high in 2000.
The implication is a test of the bottom of the red trend channel awaits a third test.
Currently this ties to the 10,000 region.
So we are at a big picture point of recognition.
Will the DJIA recapture and hold above the top of the blue trend channel or roll over?
It must be said after the 1929 crash, the market rebounded 50% in 5 months from 195 on November 13, 1929 to 297 on April 16, 1930….to its overhead 200 day moving average.
The “return to normal’ rally soon gave way to the worst of the bear market with a descent to a low of 40.56 on July 8, 1932.
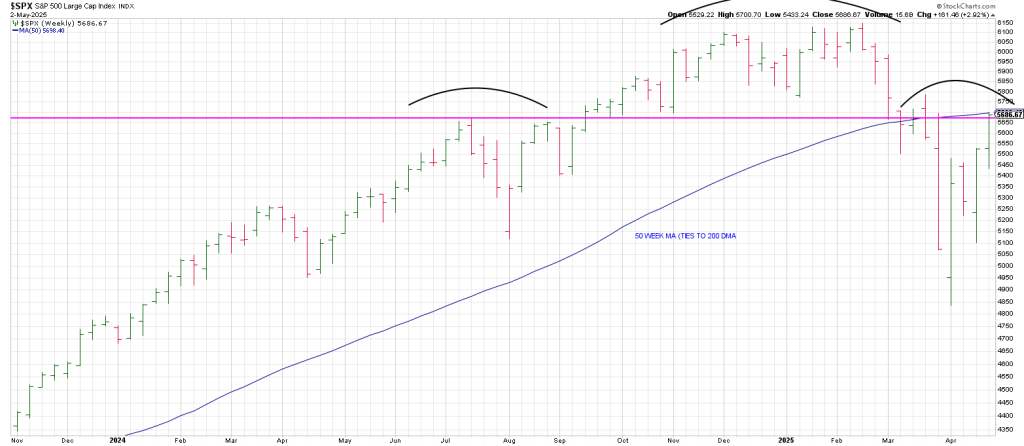
Here in 2025 the SPX has rebounded just over 17% in 18 DAYS to just below its 200 day moving average at 5646.
Indeed in the April 14th report, Slaughterhouse 5, we stated “A drive to the 5700 region may be a symmetrical double top in the context of a Right Shoulder.
Turning back to the above monthly, the DJIA shows a potential 3 Drives to a High following a long advance: this is the high in 2020, the high in 2022 and the high in late 2024/early 2025.
In sum the long advance from the 2009 low may have culminated with the aforesaid three drives into early 2025.
The Angle of Attack to the downside since February 2025 underscores the potential significance of this interpretation.
That’s the structure of the blue and red channels.
Next, I connected the top of the secular bull market in 1966 with the major top in 2000 (green Tops Line).
I paralleled that line off the major 2009 bottom.
Notice how this line caught the 2020 March crash low perfectly.
It’s a good line.
Currently the bottom of this green trend channel is around 28.000 DJIA.
That’s a long way down from current prices.
We certainly can’t use that as a sell signal —although theoretically breakage below the bottom of the green trend channel opens the door to 10,000 DJIA.
Just below the bottom of the green trend channel is the purple trend line connecting the last two bear market bottoms from 1982 and 2009 currently ties to 24,000.
Let’s drill down a monthly from 2020.
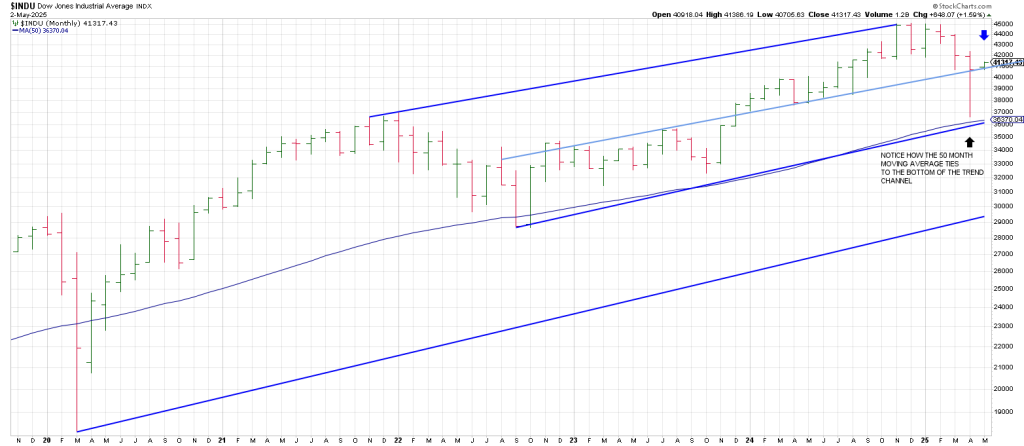
I connected the late 2021 top with the late 2024 top.
I then paralleled a line off October 2022 low.
These are the most important pivots in the last 3 ½ years.
I drew in a mid-channel line, the light blue line.
I also paralleled a line off the March 2020 crash low.
Theoretically, breakage below the lower blue line opens the door to the 30,000 region.
Notice how the after the DJIA tested the bottom of the trend channel from the Oct 2022 low
It rallied up to the mid-channel line and even Pinocchio’d it on the first rally—similar to what has played out in May.
However it took 15 months from the Oct 2022 low until the light blue mid-channel line was genuinely captured.
This was in December 2023.
Knowing that at the time would have led you to consider a leg to the uppermost blue trend channel was doable.
It was.
Are trend channels important?
In April the DJIA dropped to the bottom of the trend channel in tandem with the 50 month moving average just as it did in September/October 2022.
Is the DJIA going to power thru this light blue mid-channel line that held the DJIA in check for 15 months on the first attempt?
Or is the current poke just above the mid-channel line in keeping with the probe above the line in November 2022?
One observation is that the next time down thru the April 2025 low will trigger a Rule of 4 Sell signal (I’m using a crayon instead of a pen to assume the October 2023 low was point two in the pattern).
The likelihood is that will produce a plunge to the lower dark blue parallel line which currently ties to 29,000-30,000.
The Wave structure of the market suggests any break of major support is indicative of a Super Cycle Top as depicted in the monthly DJIA below which dovetails with the message from the trend channels from 1929.
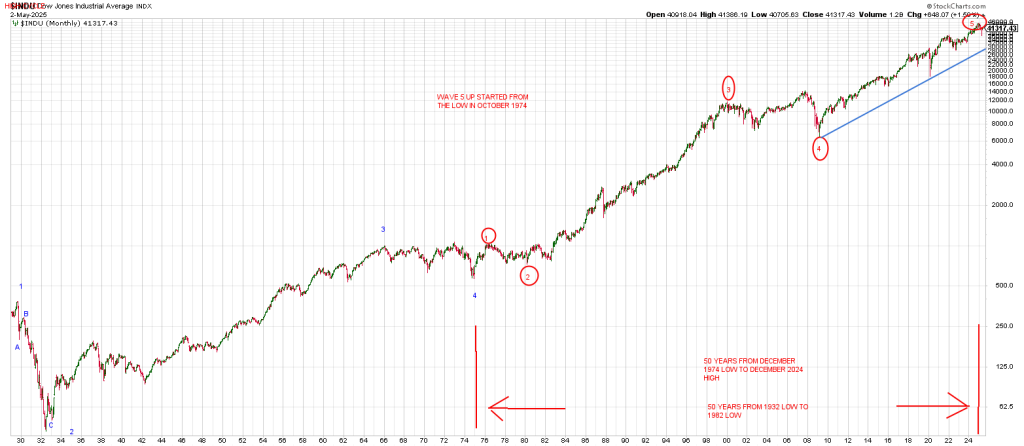
Super Cycle Wave 1 peaked in 1929 followed by an A B C Wave 2 decline into 1921
The B Wave rally was the “return to normal” rally in APRIL 1932.
Major Wave 3 from the 1932 low peaked at the secular bull market top in 1966.
Major Wave 4 bottomed in late 1974.
I have not labeled Super Cycle Wave 5 in blue yet because we have no confirmation at the moment.
However, somewhere from the 1974 low the DJIA will complete 5 major waves up for a Super Cycle Wave 3 top,
A greater degree than the 1929 Super Cycle Wave 1 top.
Counting from the 1974 low we have a Wave 1 up followed by a Wave 2 decline into 1980 (1982 was a higher low where the impulse started).
I can’t help but think that the 2 years on the side from 1980 to 1982 is being mirrored by the 2 years on the side from 2022 to 2024…As Above, So Below as Gann liked to say.
From the early 1980’s Wave 3 culminated in 2000.
The Wave 4 low was in 2009 —an A B C decline: an A Wave down into 2002, a B Wave up into 2007 and a vicious C Wave crash into 2009.
The advance from the 2009 low is a final leg in the long wave.
Whether it is full yet is yet to be determined.
That said, the blue Bottoms Line that ties to 30,000 is critical.
Currently the DJIA is at 41,300.
I don’t think you want to wait for an 11,000 point decline to know the prognosis of Mr. Market.
That is one reason why the current point of recognition is so critical.
We don’t have to wait.
An SPX trend line connecting the March 2020 low and the October 2022 low and the October 2023 low was tested at the April 2025 low.
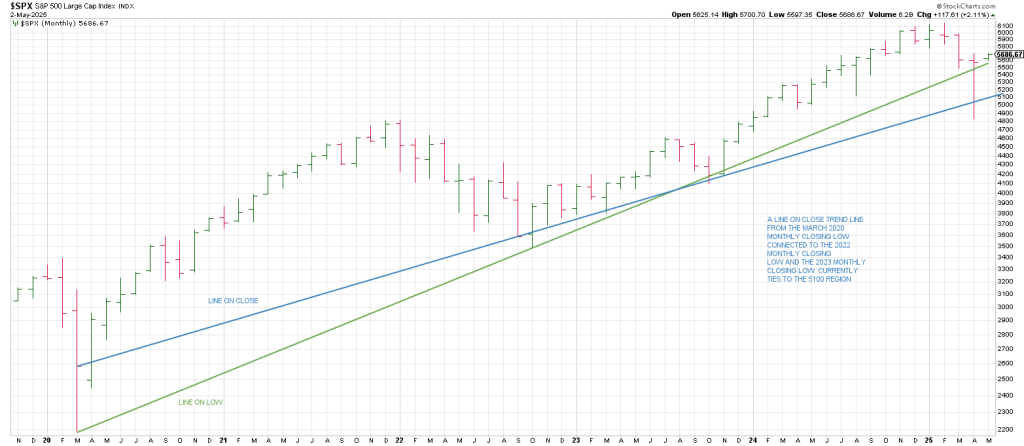
A line on close trend line currently ties to the 5100 region.
This our ‘cheater’ Get Out Of Dodge downside pivot.
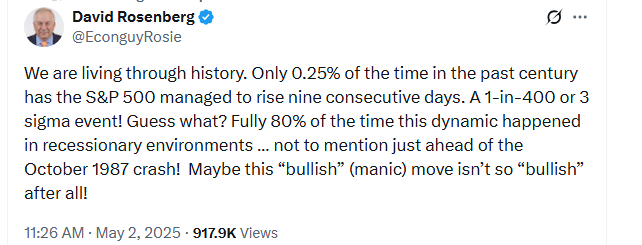
The SPX is on a rare 9 day win streak into Friday.
Not all record making win streaks are created equal.
Let’s take a look at 1987. There is a lot to glean.
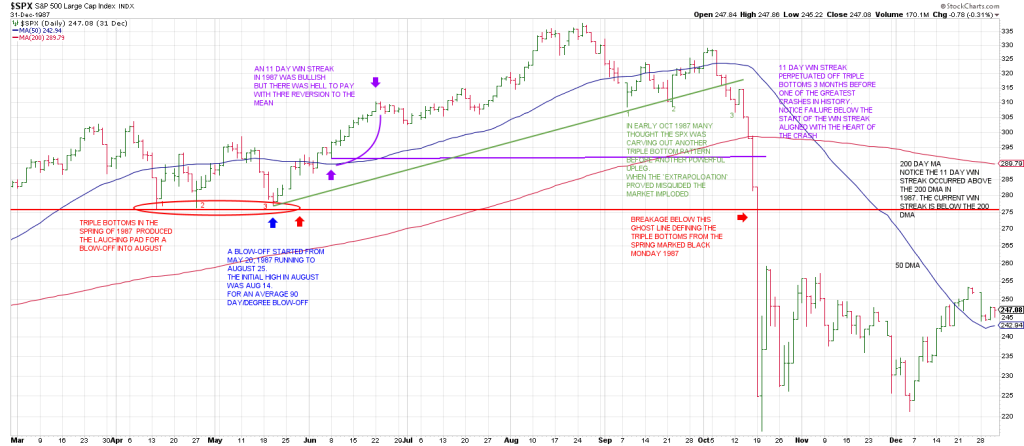
First notice the triple bottoms in MAY prior to the start of a blow-off into late August.
The win streak started in June (purple).
Notice in early October 1987 the SPX traced out triple bottoms again which many traders at the time thought was an echo of the May pattern.
It was—for 1 day.
When that “mirror” broke the SPX started to cave in.
When the SPX broke below where the 11 day win streak started, the crash of ’87 was in full throttle.
When the SPX broke below the May triple bottoms it was morning of Black Monday.
Interestingly, the 11 day win streak in 1987 was ABOVE the 200 day moving average.
The current 9 day win streak has played out BELOW the 200 day moving average.
While many proclaim the current win streak as a bullish phenomena, it isn’t so.
It depends upon where we are in The Cycle and whether the Primary Trend is bullish or bearish.
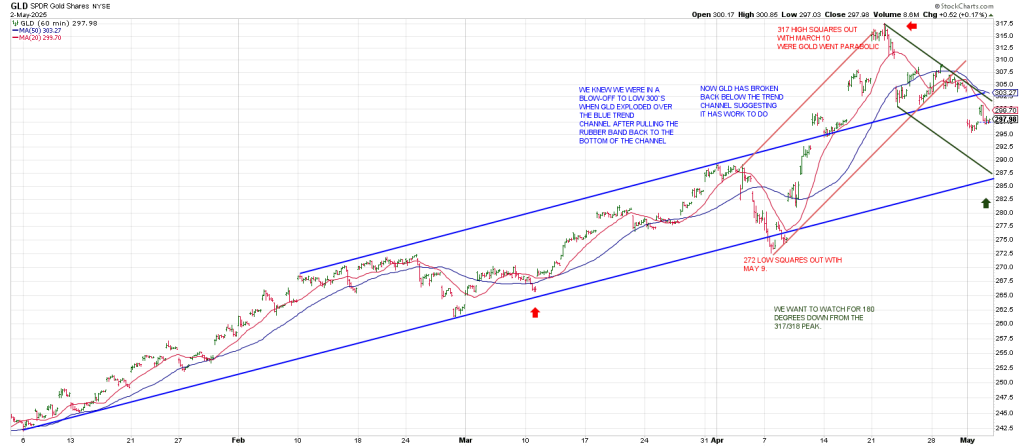
Gold Update