“If you think of the stock market as a cauldron of minestrone soup that occasionally somebody sticks a ladle in and stirs up, it takes a while before all the vegetables float back to the level that they were at before.” Seth Klarman
On Wednesday morning on the Hit and Run Private Twitter/X Feed we projected a 90 point drop in the SPX .
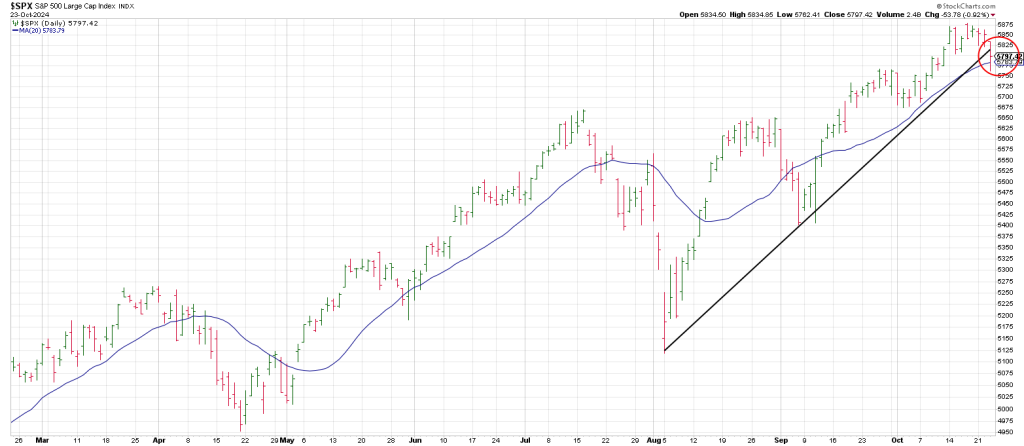
The SPX plunged 89 points breaking a Bottoms Line connecting the August and September low and bounced back to challenge it by the close.
This morning it’s squeezing above the trend line
It also dropped below its 20 day moving average (one moonth of trading days) before reclaiming it on the runoff.
Did ‘someone’ know about TSLA’s earning’s?
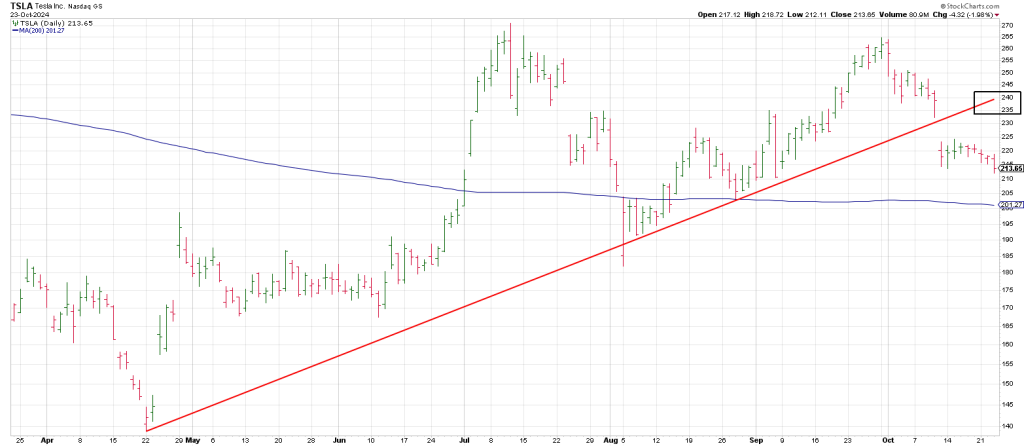
TSLA’s pattern Wednesday hardly was something to write home about.
It looked set to test its 200 day moving average following a Breakaway Gap on October 11th.
The Square of 9 implied a drop to 205 is/was on the table.
Why?
204 is 360 degrees down from the September 30th 265 swing high.
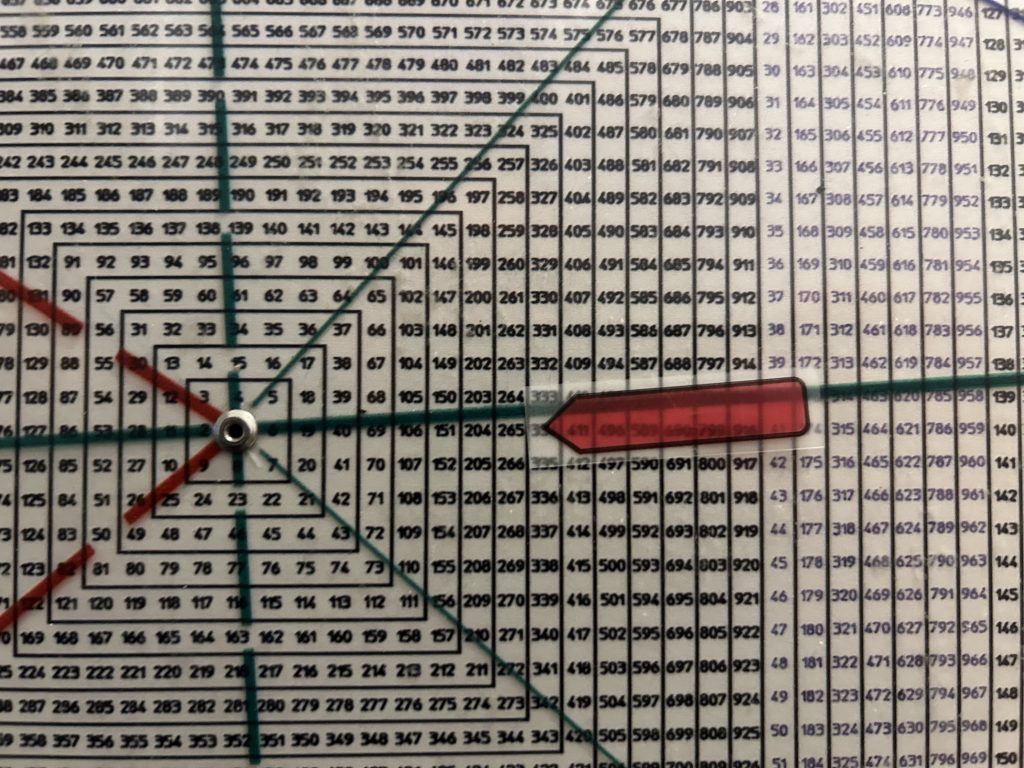
Clearly 204 and a test of the 200 day were in TSLA’s Wheelhouse.
Is it possible TSLA reverses and drives to the 205 strike for OpEx tomorrow?
Instead TSLA is ripping after reporting, backtesting its overhead and declining 20 day moving average and filling the open gap from October 11.
The close on October 10th was 228i.77.
This is going to be interesting. Is TSLA geared up for an Earnings Reversal U-Turn?
Likewise, on the heels of TSLA’s print, the SPY is backtesting yesterday’s Breakaway Gap.
The SPY closed at 583.32 on Tuesday. It opened at 581.26 on Wednesday.
Today is an historic day. It is the 95th anniversary of the air coming out of the Roaring Twenties bull run in 1929.
Maybe something, maybe nothing, but on the Square of 9 the number 95 squares out with October 29th, the third of the great crashes in late September 1929; the first one being October 24th.
You may think this is voodoo, but I assure you that time and price harmonics govern the market.
For example 58 years after 1929 is 1987.
The number 58 squares out with October 29ith. The Great Crash.
If you were bearish in 1987 and recognized in the summer of 1987 that the pattern playing out was quite similar to 1929 as did Paul Tudor Jones, the presumption would have been that there is a definite ‘vibration’ or synchronicity with October 1929 and October 1987.
This is not an isolated example.
Prior to the Great Depression the panic in September 1873 that started a two decade long depression was known as the Great Depressioln. After the 1930’s low it became the Long Depression.
It is 56 years from 1873 panic to 1929 panic.
56 squares out with November 13th, the day the panic ended in 1929. The low of the year in 1929 before a 5 month bounce back into April 1930 (180 degrees from the October crash)
Not all Bounce Backs are created equal.
Interestingly we are 37 years from the 1987 crash.
37 is straight across and opposite November 5th, election day.
This is 90 degrees/days from the Flash Crash on August 5th, 2024.
In sum, now the SPX shows a 3 point trend line connecting the August/September lows with yesterday’s low.
The third break through this Bottoms Line will produce a Rule of 4 Sell signal.
In tandem with breakage below the SPX 20 day moving average it should perpetuate accelerated momentum to the downside.
Let’s see how long this Bounce Back in TSLA lasts.
Let’s see if the SPX can generate traction off yesterday’s Holy Grail (20 day moving average).
One earnings report, does not a change in trend make.