The biggest risk is the one you don’t see.
On Wednesday, October 9th, the SPX closed at a record high, yet the McClellan Oscillator, an excellent measure of momentum, registered one of the most negative readings ever at an all-time high, based on a century of data.
The McClellan Oscillator closed at -34.02.
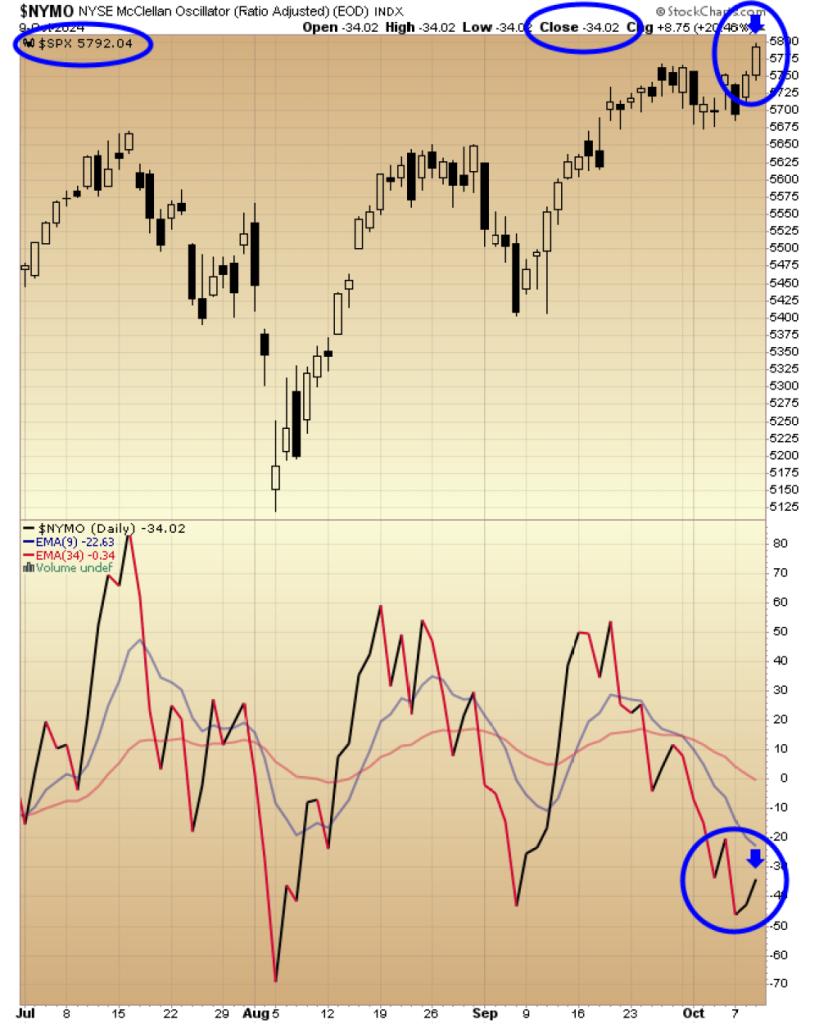
Of the continuing warnings I’ve been detailing in this space such as a litany of Time/Price square-outs, astrological cycles, market cycles, wave structure and pattern analysis, Wednesday’s is like the cherry on top of a Risk Pie.
The only other time I can see where the McClellan Oscillator was more negative that Wednesday’s in league with the SPX at an all-time high was November 18th, 2021.
November 2021 was the Primary High in the SPX and DJIA.
A sharp drop played out when the SPX pushed to a nominal new high on October 22 and tailed off producing a Soup Nazi sell signal.
The SPX dropped 4% in SEVEN days testing its 50 day line.
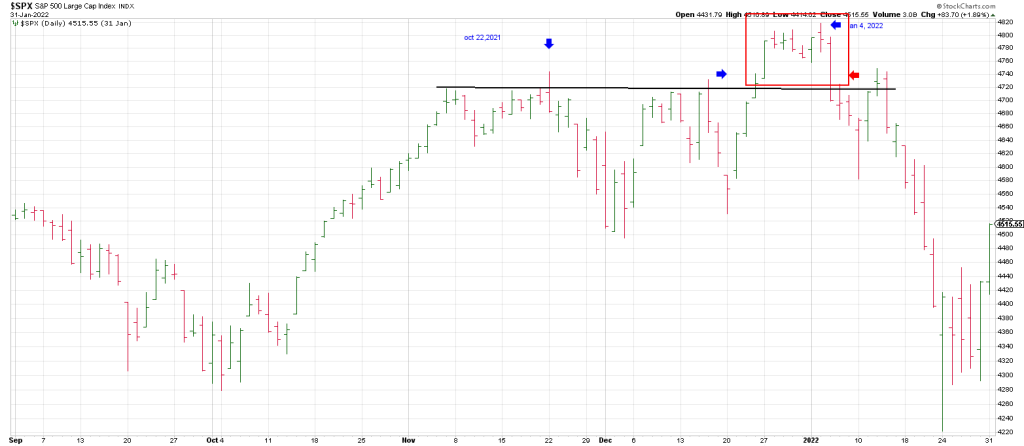
Notice that the SPX tried to hang on for two days following the Nov 22 signal reversal bar: 2 Paws Days. What when the selling hit, it hit with authority with a Breakaway Gap on November 26th.
Ultimately the index eked out a new high on December 27th and “one more for the road on January 4th, 2022.”
What’s interesting is the entire pattern from November 5th to January 4th looks like a fractal of the pattern from mid-July 2024 to present.
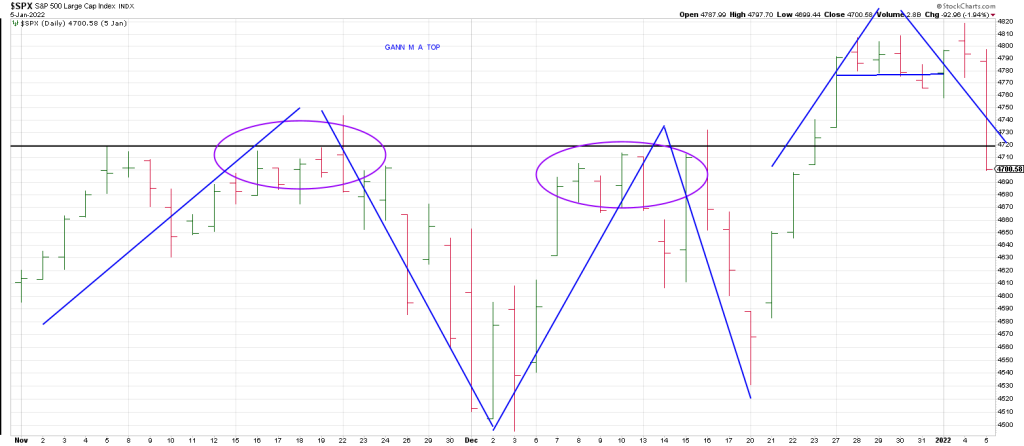
Notice the Gann M A Top.
The double tops in November/December 2021 mirrors the double tops in the summer of 2024.
The double tops in 2021 saw an intervening drop and a return rally that carved out a nominal new high. A “cherry on top” final fling attempt played out on January 4th.
The double tops in July/August 2024 show a larger intervening plunge than that from 2021, followed by a nominal new high and then a last ditch “cherry on top” breakout…yesterday.

Notice the Gann M A Top …with a potential larger “A” climax run.
In sum, it’s going to be fascinating to see if indeed Wednesday and the next few day’s potentially mirror the top formation in January 2022.
Interestingly, the November 22nd , 2021 high is the anniversary of the Primary Low on November 21st, 2008.
As well, Wednesday marked the 16th anniversary of the CLOSING high in 2007.
The market struck a fresh intraday high on October 11, 2007.
Just as the November 2008 anniversary in 2021 proved significant, I can’t help but wonder if this anniversary of the October 2007 major top will prove to be a significant top.
In 2007 there was an important initial top in mid-July.
Ditto 2024.
In 2007 the Fed cut rates 50 bps on September 18th.
Ditto 2024.
The SPX is in testing two square-outs flagged in this space.
5780 (578) squares-out with August 5th, the Flash Crash low.
5810 (581) squares out with the 51 (5810) low on August 5th.
If this week proves to be a high, the heart of the Gann Panic Zone ties to November 21-22…the GFC Crash low in 2008, with the anniversary of the 1929 low being November 13th.
I mentioned many times that 95 squares out with this week with October 2024 being 95 years from October 1929…just as it was 58 years from 1929 to the crash of October 1987 with 58 squaring out with October 29th…The Big Kahuna.
The final interim rally high in 1929 was October 11th, that’s this Friday.
In sum, IF this week is a major top, it points to a Gann Panic Zone in mid to late November synchronous with the 1929 low and the major low on Nov 21, 2008, the low around the world and the NDX low. In March 2009 the NDX struck a HIGHER low.
Markets play out in 3’s. The third anniversary (36 squared months) of the November 2021 top look
Significant.