Despite positive breadth of 505 net advancing issues, the McClellan Oscillator remained negative on Monday.
This mirrors the conditions seen at the peaks of major bull markets in 1961, 1973, 2007, and 2007,
These periods marked the end of sustained bull cycles and the onset of deep bear markets.
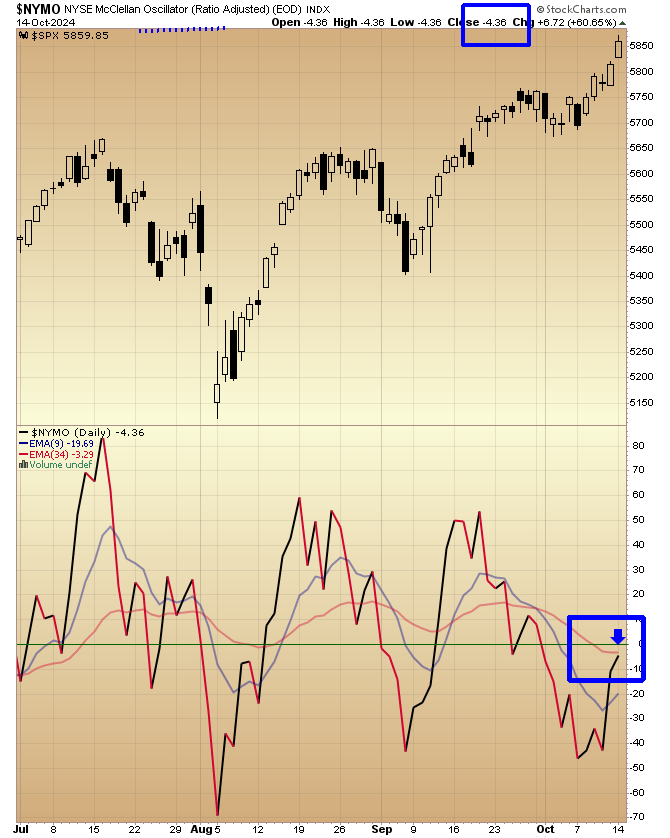
This observation holds significant weight. Each major bull market peak of the past century—
Including those in 1929, 1937, 1861, 1973, 1987 and 2000, 2020 and 2021-22— was characterized by a McClellan Oscillator reading that was either negative of barely positive at the top.
Specifically my attention was drawn to the mid-November 1961 top.
That top was defined by a conspicuous pattern of 3 Drives to a High culminating an advance that started in October 1960—1 year earlier.
(I’m unable to pull a chart of 1960-62 for the moment but do check it out)
Our current advance started from an October low 1 year ago and shows a conspicuous pattern of
3 Drives to a possible High.
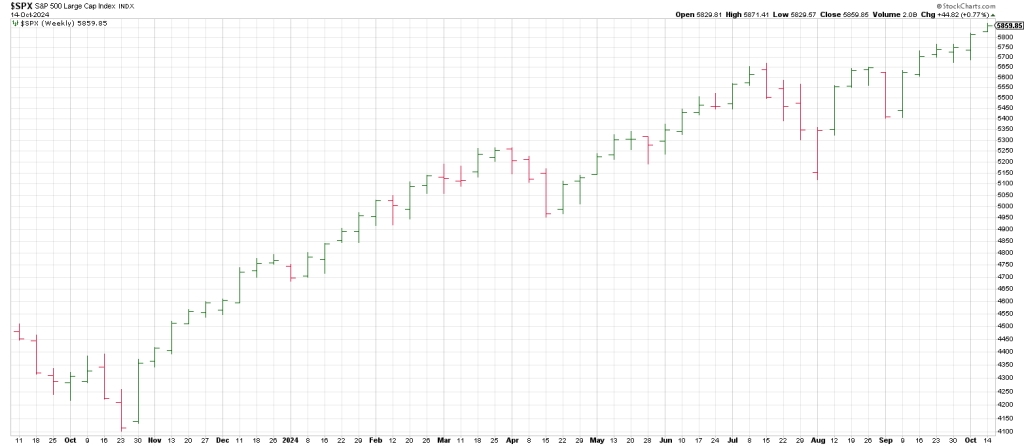
Let’s compare the 1961 top with the current pattern.
The 1962 crash was on when the DJIA triggered a Rule of 4 Sell in April, five months after the top.
Tops can take the shape of a long distribution such as 1961 that carved out a weekly head and Shoulders or they can be blow-off tops like 1929 or 1987.
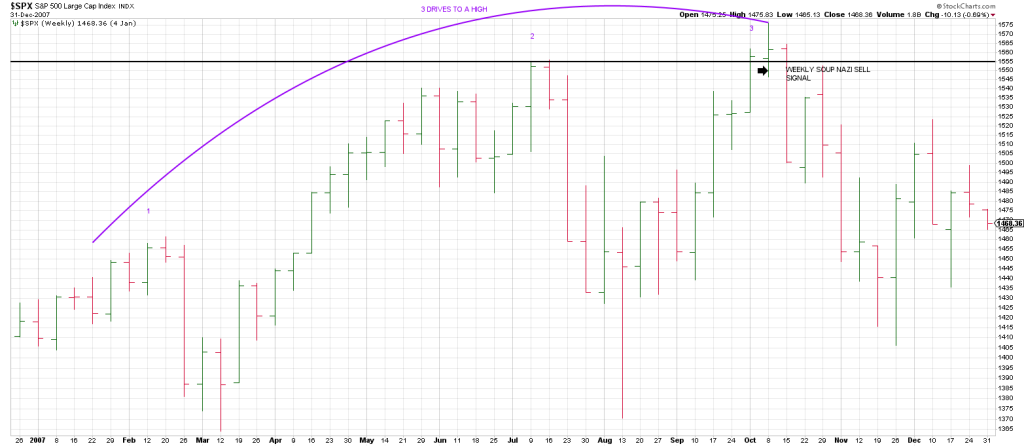
The 2007 top also emanated from a conspicuous pattern of 3 Drives to a High.
Once the 3 Drive concluded in October ’07, the SPX started to collapse without a sideways stint of distribution
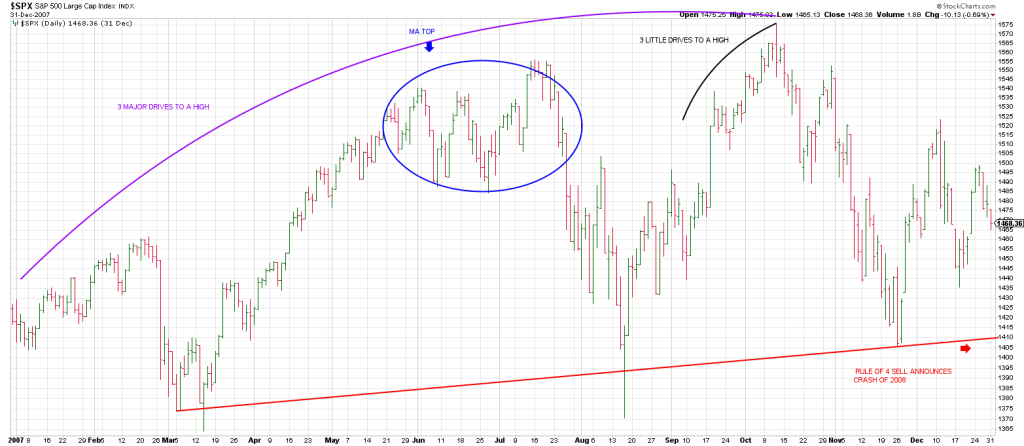
Notice the weekly Soup Nazi sell signal in October 2007.
The DJIA never looked back.
We do not have the setup for a Soup Nazi sell currently.
However, we do have a breakout from a double top on the DJIA and SPX forming what looks like
A Gann M A Top. We’ve shown it several times in this space.
Let’s take a look again.
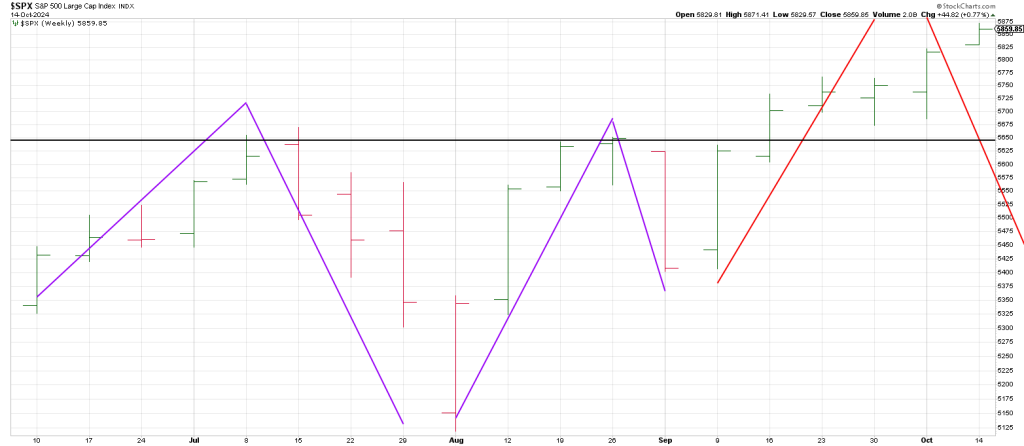
Breakage below the peaks of the ‘M’ are a sell signal.
Given the weak McClellan readings currently synchronous with other major tops, downside follow through below the peaks of the ‘M’ around 5650 indicates a major top is on the table.
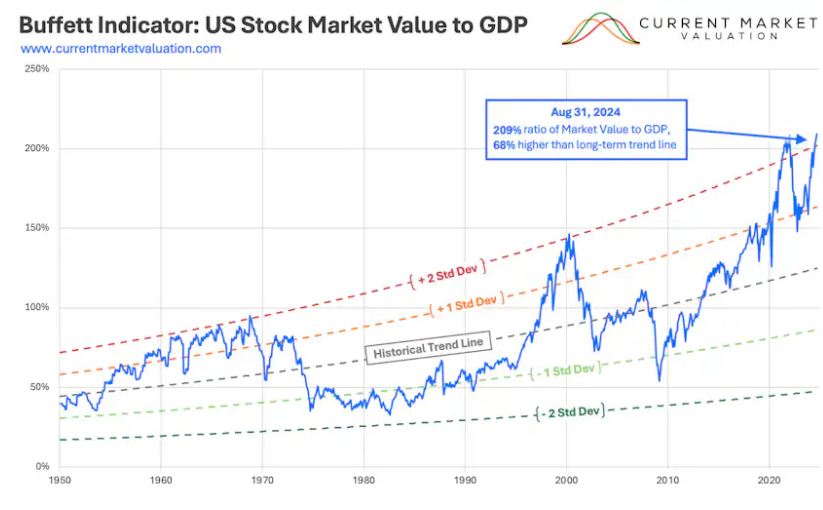
Coupled with valuations vis a vis the Buffett Indicator shown below, a failure below the last breakout pivot at 5650 ish may be a sell signal for the ages.
There is a mirco Gann M A Top on the dailies which can give us a heads up to trouble.
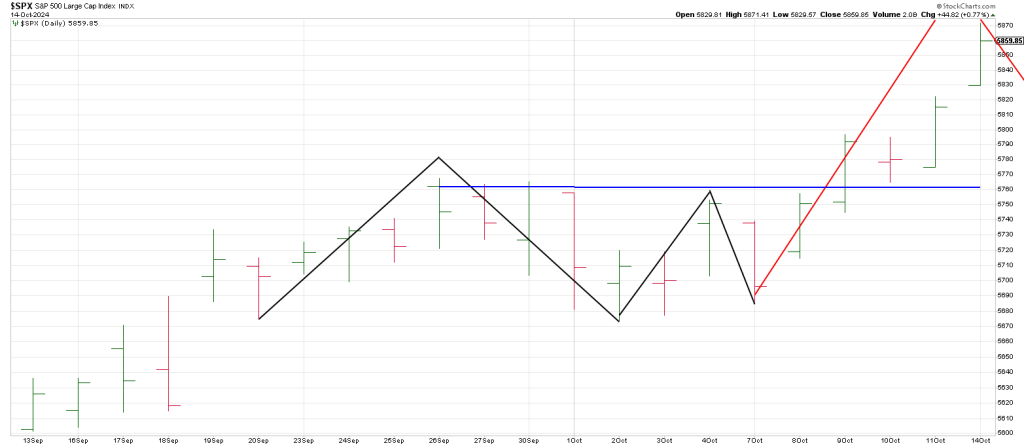
We are in a the ‘A’.
Breakage below the peaks of the ‘M’ around 5765 is a warning shot over the bow.
In sum weak momentum (as evidenced by the McClellan readings) has consistently signaled the final stage of a bull cycle. History suggests that this current bull cycle will likely follow this pattern, and we appear to be on the verge of that reversal.