“When under the hood something’s up to no good” Breakdown on Interstate 80, Down and Above
Despite what we may all want to believe and what can be figured out fundamentally, sometimes it is just about trend lines.
Faraday said, “There is nothing in the universe but mathematical points of force.”
In markets, trend lines often reflect these points of force.
There are many ways to draw trend lines. The ones that count don’t lie.
Not all trend lines are created equal.
A good trend line should have a least 3 points.
To “prove” the significance of a trend line a channel created by paralleling a line off it
Should define turning points.
This gives us valid points to take the markets temperature.
Below is a daily NDX from January 2020 thru January 2022, just after a major top was struck on November 22, 2021.
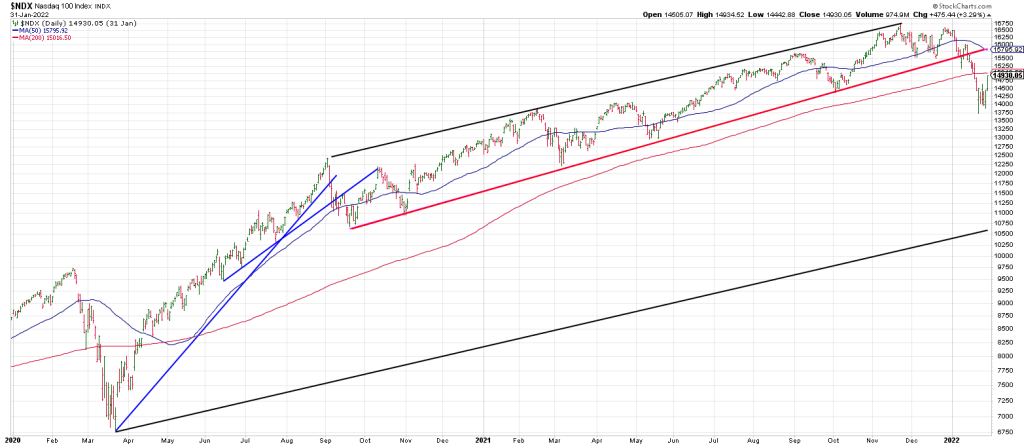
The first high following the ramp off the March 23, 2020 Covid Crash low occurred on September 2, 2020.
The best trend lines tie to time.
They don’t exist in a vacuum.
Allow me to explain.
The low in June 2020 is basically 3 months or 90 degrees/days from the March 23rd low.
The June low was defined by a turndown in the NDX 3 Day Chart.
I connected the June low with the 3 subsequent lows to give a valid 3 point trend line (blue #1).
That trend line was violated in early September 2020.
The September trend line break was validated by the fact that the correction was an “overbalance” of the prior advance. In other words, the downdraft off the Sept 2nd high was the largest correction since the rally started in March.
Most technicians “throw away” a trend line after it’s violated believing it has served its usefulness.
I disagree. I have proven to my complete satisfaction over the years that these “mathematical points of force” extended into the future can be a valuable resource.
I call these Ghost Lines.
For example note how blue trend line # 1 extended into the future nails the rally high on October 12th.
The correction from the September 2, 2020 top was also the largest since the March low because it snapped a 3 point trend line connecting the March low with the July low and the August low.
This is blue trend line # 2.
The September 2, 2020 high prior to the correction reflected by these two trend lines becomes an important point to measure the market.
I connected that September 2, 2020 high with the next top in February 2021. (black Tops Line).
This is very important:
- Notice how the pullback low following the September 2 peak was Sept 21-Sept 24. This is exactly 180 degrees/days from the March 23, 2020 low. Mathematical points of force in TIME.
- Once that September low is in place and has been tested I can start a bottoms trend line (red). Paralleling the black Tops Line off the, at this point. short red trend line gives the February 2020 peak.
Notice that the next important correction tests the red trend line. Now we have an important 3 point trend line. Notice that the March 2021 low is approximately 360 days/degrees from the March 2020 crash low.
Got Geometry?
Here’s the pay off.
Extending the black Tops Line shows that the THIRD point is the precise high day on November 22, 2021.
The November 2021 top is a cycle off the February 2020 pre-crash top.
Why?
18 months is an important cycle. It is a true square-out, a cube-out in time as a cube has 6 sides with 90 degree angles each—so 6 X 90 = 540 degrees.
540 days/degrees from the Feb 19, 2020 peak is August 2021.
THE NOVEMBER 2021 NDX TOP IS 90 DAYS/DEGREES LATER or 630 degrees later.
It represents a 90 degree Throw-Over or blow-off.
On November 21, 2021 following a third touch of a trend line from the initial momentum peak on September 2, 2020, the NDX left a Key Reversal Day.
When the bottom of a one year + trend channel was broken (red Bottoms Line), it was the Sign Of the Bear (SOB).
Notice the break of the red Bottoms Line was quickly followed by an authoritative break of the 50 day line signaling the Bear was out of hibernation.
It was the first time the 50 DMA had been violated since reclaimed shortly after the March 2023 low. It would not be recaptured again until one year later in January 2023.
Breakage below the well-defined red Bottoms line from September 2020 was the Bear’s calling card.
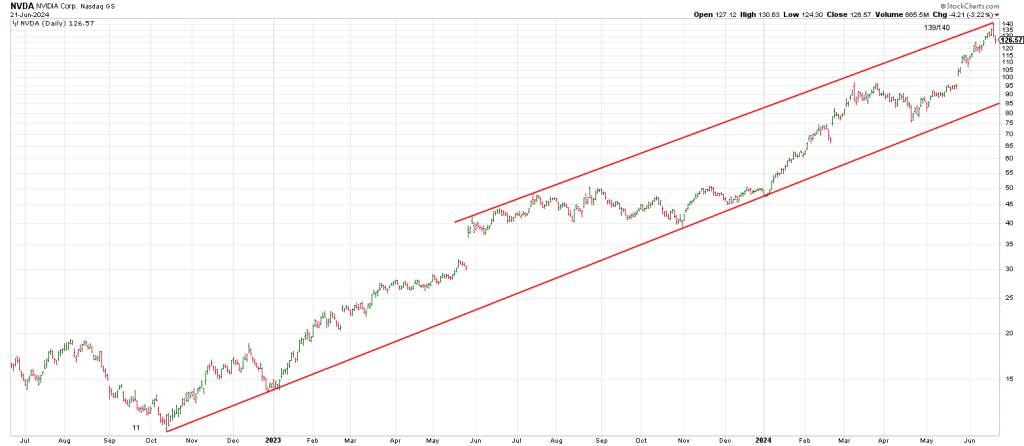
Let’s take the same chart and go forward in time.
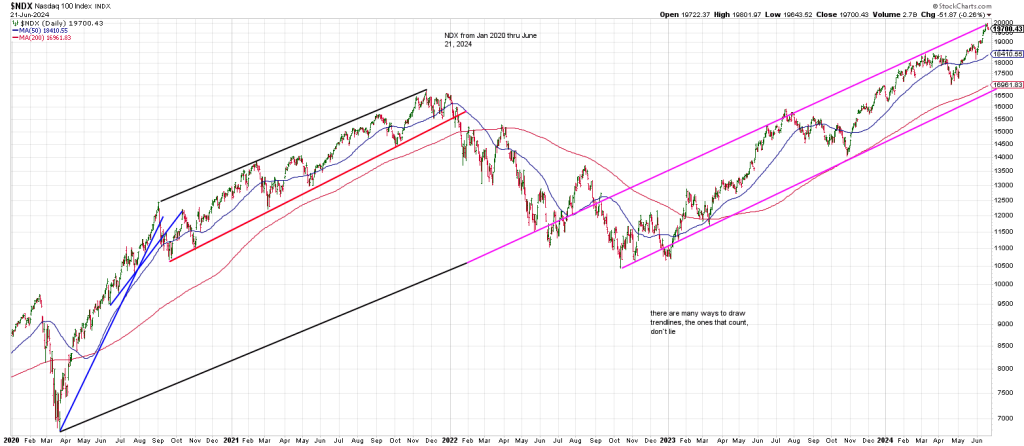
I paralleled a line from the black Tops Line off the March 2023 crash low.
On the above chart, I extended that line (magenta).
Notice the June 2022 Primary Low tags that line.
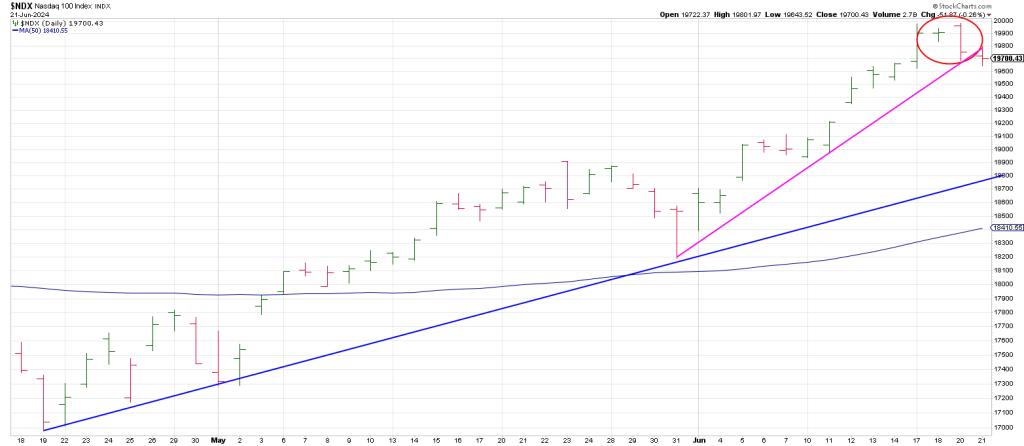
Extending the same black to magenta trend line gives the July 2023 top, the March/April highs and it was just struck again.
It looks like 3 Drives to a High from my perch.
Even in an ongoing bull market, the normal expectation would be for a drop to the bottom rail of the channel at the 15,500 region. This ties to the 50 day line and the March high.
It looks like a Technical Trifecta is on the NDX table.
When will the market react?
Given Thursday’s Key Reversal Day, it looks like it’s started.
Moreover, June 20th is 90 days/degrees from the March 21st high/reversal that perpetuated the drop into April 19th.
As in the November 2021/January 2022 pattern high, we may see something similar going into July:
A high here in June, a pullback and a test of highs in July.
July is 270 degrees (9 months) from the October 2023 low.
July is 90 degrees (3 months) from the April 2024 low.
July is 360 degrees (1 year) from the July 2023 crest.
July is 180 degrees (6 months) from the January 5th low that was the launching point this year’s Runaway Move.
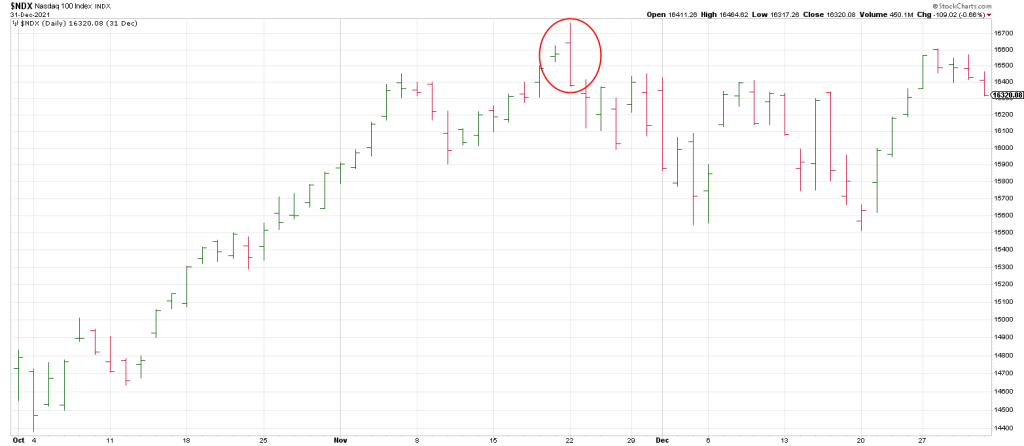
In sum, following a Runaway Move, the NDX left an indecision bar on November 19th 2021. The next trading day, November 22, 2021 the NAZ left a Key Reversal Day. It marked a high that would not be exceeded for 2 years and 3 months.
Last week following a torrid run, the NDX left an indecision bar on Wednesday followed by a Key Reversal Day on Thursday.
The patterns look stunningly similar. And, following the largest Quadwitch options expiration ever with only modest volatility in a market where liquidity is dominated by non-fundamental factors magnified by indexing and short-dated options, there is an increasingly obvious and greater risk that any “event” could have a greater impact and consequent.
Conclusion. In addition to my San Andreas Fault Indicator (flagged last week) price momentum has been exacerbated by Quadwitch and quarter-end window dressing.
Whether, as explained last week, a large mutual fund Pump and Dump ahead of quarter-end was the culprit behind Thursday’s reversals in generals, NVDA and QCOM, remains to be seen.
Be that as it may, Thursday morning’s Hit and Run Report warned of square-outs on both NVDA and QCOM.
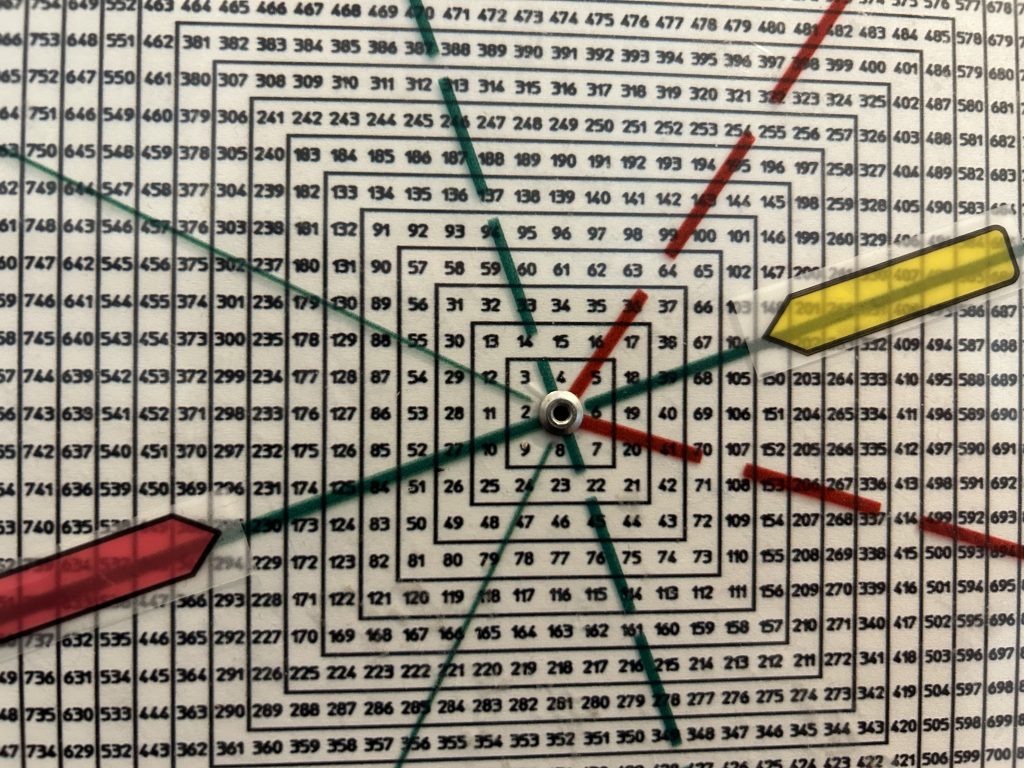
We showed the NVDA Time/Price square-out with 139 and June 20 in Thursday’s morning report.
Hit and Run shorted NVDX as a proxy Thursday morning.
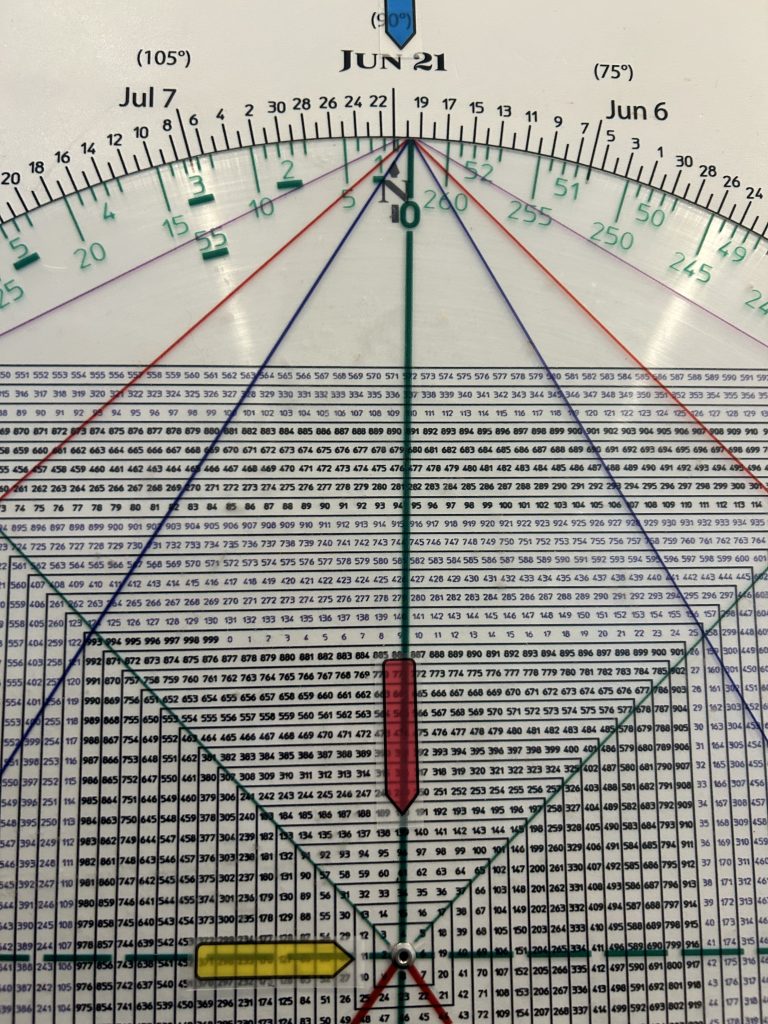
139 aligns with June 20th and squares 11, the post-split price at the October 2022 low.
Large Range Key Reversal Day’s don’t necessarily lead to an immediate swan dive, but they can leave a mark.
For example NVDA left a Large Range Key Reversal Day on March 8th. Following a text of the highs it sold off undercutting its 50 day line.
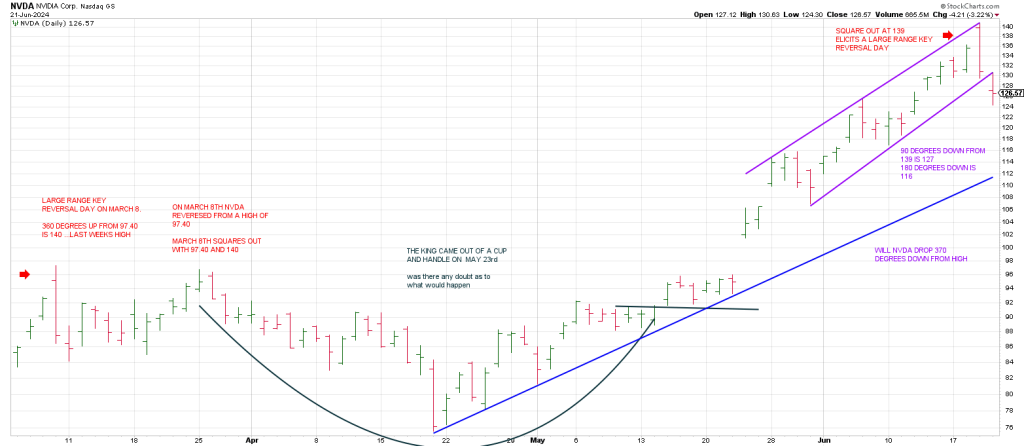
The high of the March 8th KRD was 97.40. Remarkably, 360 degrees up from 97.40 is last weeks 140 record high.
March 8th also squares out with 97.40 and 140 for Time/Price square-outs.
Amazing.
Will NVDA drop to its 50 day line again?
Currently the 50 DMA ties to 101 and an open gap from May 23rd, when it came out of a Cup & Handle.
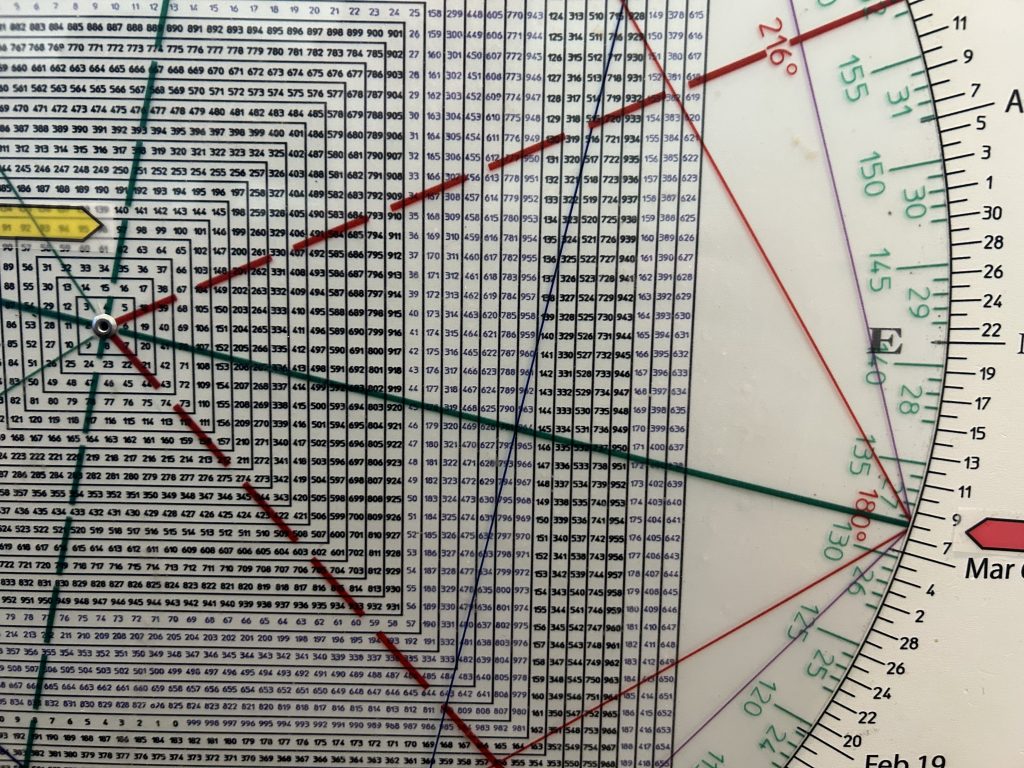
We flagged the price square-out in QCOM at 230 on the Hit and Run Private Twitter Feed on Wednesday.
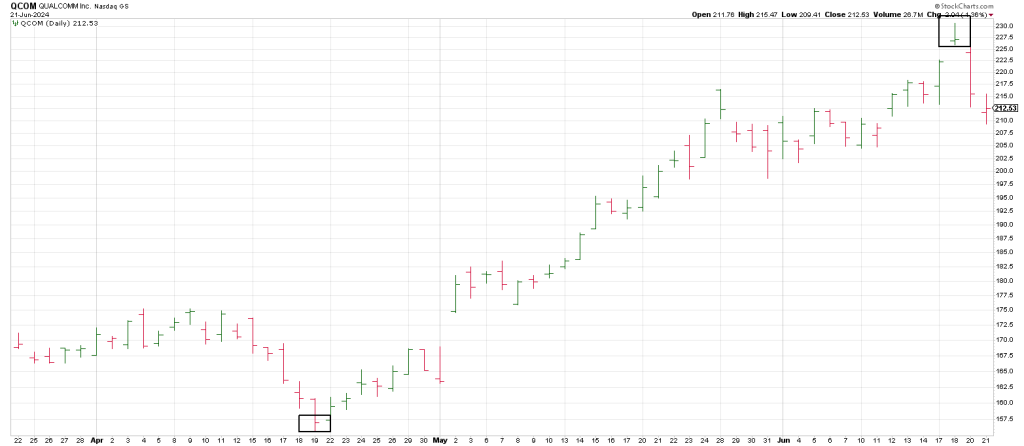
230 is 180 degrees straight across and opposite 104, the Oct 26, 2023 low.
Last week NVDA became the largest U.S. company by market cap.
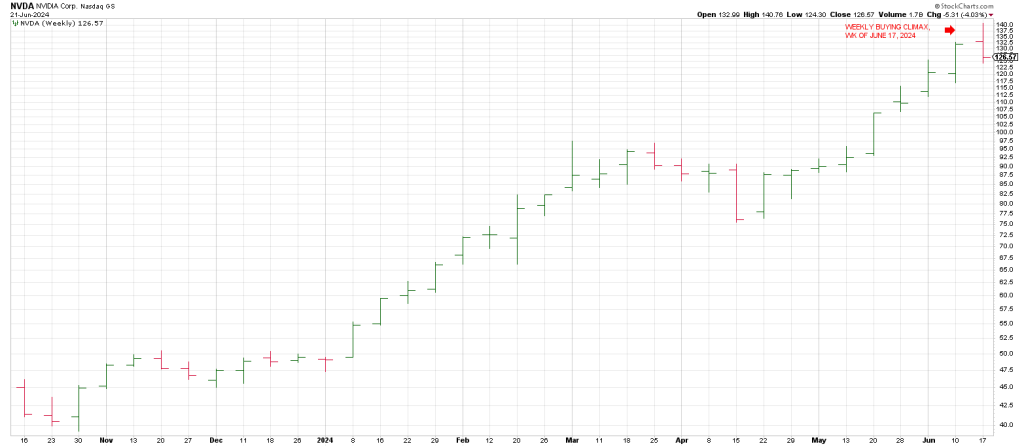
In addition to a Key Reversal Day, this single biggest driver of the market advance also left a weekly Buying Climax last week. It made a new all-time intraday high but closed the week lower, near the bottom of the week’s range.
Above we looked at the NDX from its November 2021 peak.
NVDA also left a weekly Buying Climax at the high on the week of November 22, 2021
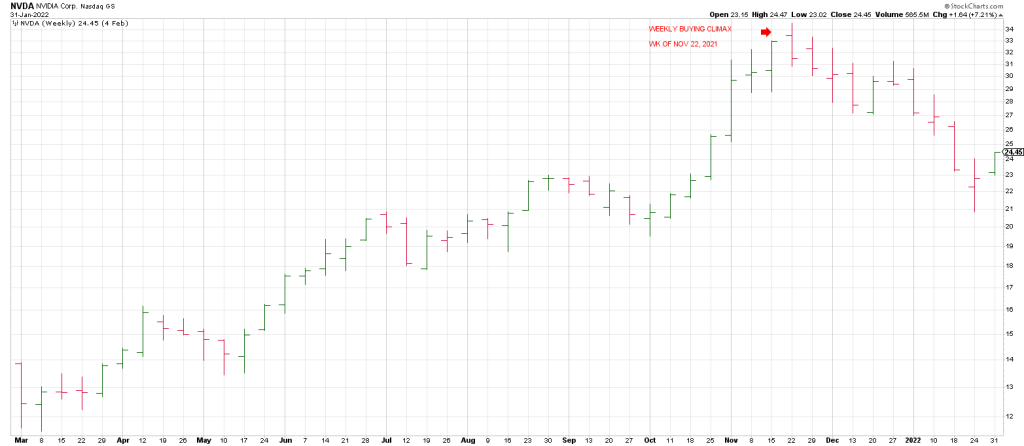
Is NVDA telegraphing a high in the markets again?
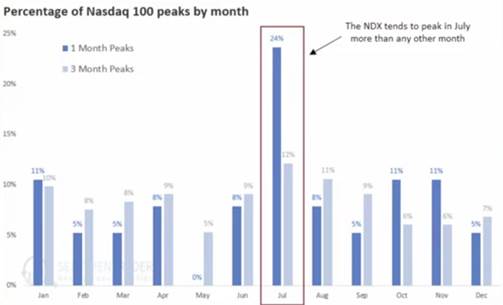
In addition, to the above cluster of canaries in the bear mine, we have seasonality.
The NDX tends to peak in July more than any other month.
The NDX low close at the Oct 26, 2023 bottom was 343.66.
One full 360 degree cycle up is 421.
540 degrees up or a cube-out from the low is 463.
A 90 degree throw over is 485. This is the record closing high last Wednesday.
In other words, the 343 Oct 2023 low squares out with 485.
Last weeks NDX intraday high is 486.86.
489 is straight across and opposite the October 26 low.
If the NDX rallies above last weeks high to the 489 region over the next week or so and Jackknifes back below it in short order it will trigger a Soup Nazi sell signal…no soup for those who buy the new high.
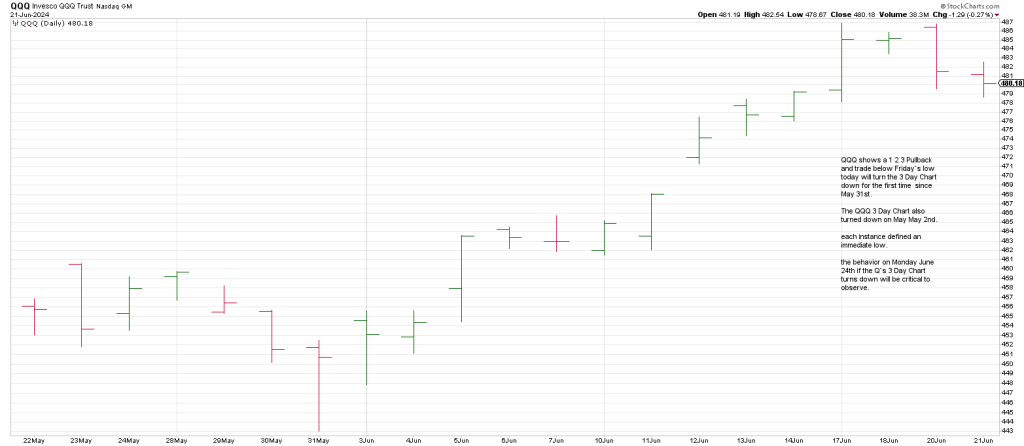
Today we want to see if the QQQ 3 Day Chart will turn down.
If so the ensuing behavior will be critical to observe.