“And it seems such a waste of time
If that’s what it’s all about
Mama, if that’s movin’ up
Then I’m movin’ out.” Movin’ Out, Billy Joel
Markets extended their recent rebound on Tuesday, with the DJIA gaining 300 points, the SPX up 32 and the NAZ adding 95.
The Q’s kissed the dual 475-480 square-out region with a high of 476t.42 before settling at 475.53.
In so doing it satisfied a backtest of its declining 50 day line—typically a bearish juncture.
Despite the advance, market internals were only moderately positive as net advances totaled +823 on the NYSE and +1,042 on the NAZ, suggesting a rally with limited breadth beneath the surface.
Notably, the 20, 50 and 200 day moving averages for the SPX continue to trend lower, reflecting a broader loss of momentum even as price has bounced….albeit the SPX and QQQ are trading above their respective 20 day moving averages; the average itself is pointing down in both instances…although attempting to curl up.
A 50% retrace of this year’s sell-off in the Q’s is 471.60.
We have closed above that level for 3 consecutive days.
You know my rule about rebounds that capture more than 50% of a flush: often it indicates a return to the highs or a new leg past the highs.
However, in my experience, a close above the mid-point on the Friday weekly closing basis is key and protects one from “jumping the gun” prematurely.
As well The Wheel is allowing for 480.
As to the SPX a 50% retrace is 5491.
The SPX has closed above that level for 3 consecutive days as well, also backtesting its 50 day line.
Again a close above 5491 on the Friday weekly basis must be respected until proven otherwise.
Yes it seems a long way down to 5491, but note that Monday’s sell-off struck 5468.
100 points in this market has become an after-thought.
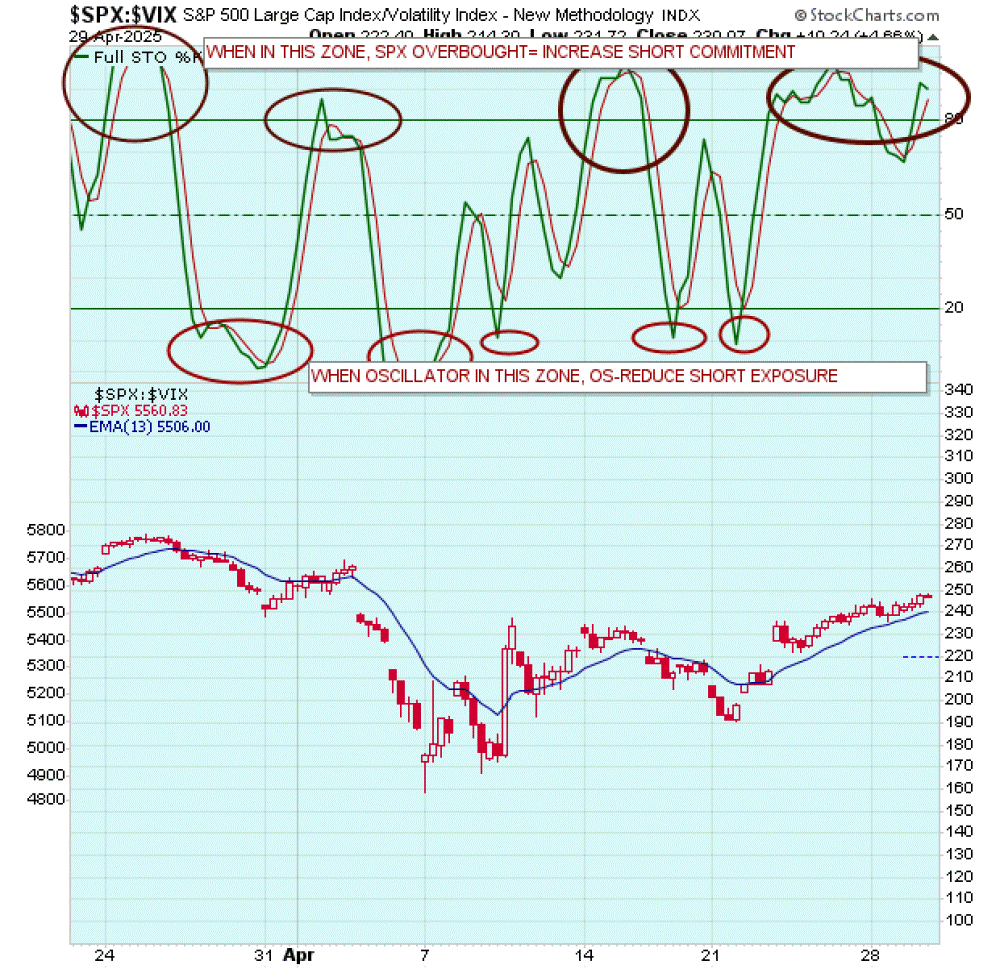
The SPX remains overbought on a short-term basis. The weekly oscillator which peaked last week, began to turn lower on Tuesday, signaling the potential start of a leg down.
This morning we get the release of preliminary Q1 GDP, a key report to set the tone for the session and perhaps the week and the month of May.
With the expiration of April options looming at the close today, the expectation is for heightened volatility and significant position adjustments across equity, fixed income and currency markets.
Please review this video if you have not already
In sum, the talented Mr. Market is famous for making things appear bullish right at a top and bearish right at a low.
We’re at a juncture recognition. Let’s be on our toes. Either path here is going to be eventful: a drive to new all time highs or a continuation of the bear and a drop to new lows for the move.
Wednesday’s Roadmap
The Roadmap is projecting a doozy of a Thursday —consistent with the GDP report
And end of the month market expirations.
From a 9:45 ish high a drop into 10:45 followed by a rally into 11:45.
Another deeper sell-off is projected from there into 2:45 theoretically the low of the day followed by a spike theoretically to the high of the day
At 3:20 and a pullback into the bell.
So from a projected low of day at 2:45 there is a projected high of day at 3:20.
Can Mr. Roadmap make amends for Wednesday today?
He was right about a drift but the downside call inverted.
TWO potential Inversion Pivots
1) 12:40 in the middle of an indicated pullback
2) 2:15 on the way to the indicated low of the day