“You’re the man who squats behind the man who works the soft machine.” Memo From Turner, The Rolling Stones
“Herding is not necessarily something one does as the result of analysis. It is what one does when one’s confidence is impaired.” Daniel Kahneman
Below is a weekly SPX from July 2025.
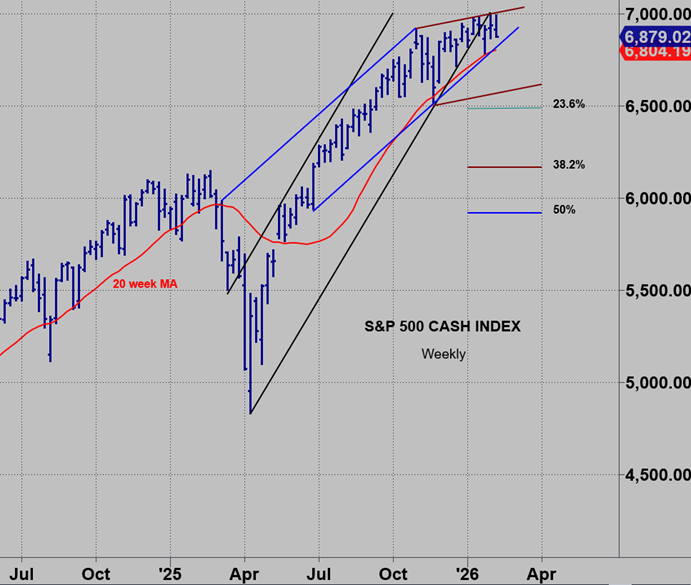
Since the April 2025 low the index has tested its 20 week moving average twice—in mid-November and again in mid-January.
Follow through below Tuesday’s low opens the door to another test of the 20 week moving average currently at 6806.
Checking the relationship between the SPX and its 20 week moving average from 2024, we see that the 20 week ma was tested in July 2024, January 2025 and in April 2024 (not shown).
Three times it was tested successfully.
I don’t call it the Holy Grail for nothing.
The fourth time through the 20 week moving average in Feb/March 2025 perpetuated a waterfall decline into April 7th.
The question is if the SPX tests its 20 week ma again will it produce another rally as it did in the last two instances or will the third time be a charm for the Bear?
What’s interesting is that the SPX has broken a steep Bottoms Line from the April low three weeks ago with each rally attempt hitting its head on ‘The Line”.
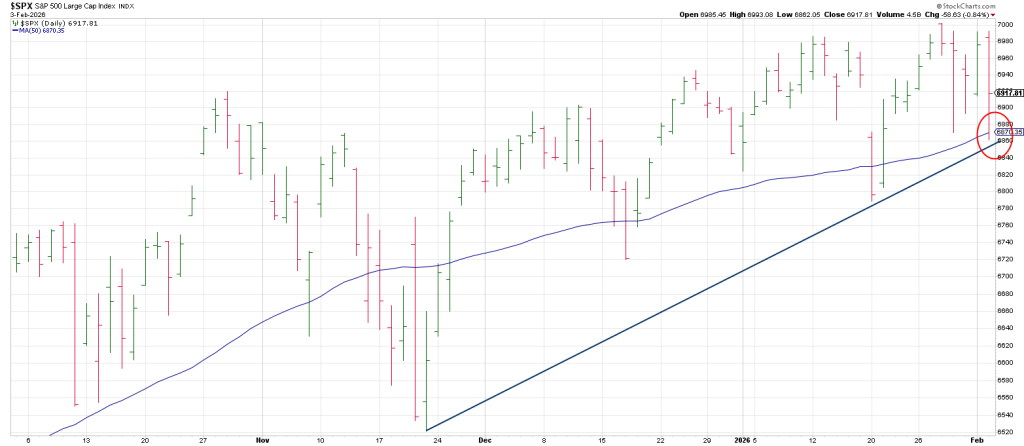
As well a daily SPX shows that Tuesday’s drop tested the 50 day moving average and a Bottoms line from November. Before eliciting a 50% retrace of the day’s decline.
It appears the reason why the SPX held the 50 day line on Tuesday versus the undercuts in November, December and January is because now the 50 dma ties to a trendline defining support since late November.
However, now we have a 3 point trend line with breakage triggering a Rule of 4 sell signal.
Consequently, downside follow through in coming hours/days indicates a drop below Tuesday’s low will break two important levels: the 50 day ma as well as the aforesaid trend line from November.
This ties to 6870 to 6860. On the dailies.
The key support level on the weeklies is 6890 which was broken intraday but held on a closing basis.
Downside follow through opens the door to 6500 which is a 23.6% retrace of the advance from last April.
Below that is a 38.2% retrace to 6150 which ties to last February’s high.
Below that is a 50% retrace to the 5950 region.
Tomorrow’s report will show multiple big picture square-outs from the high.
Be that as it may, yesterday’s rebound backtested a short term broken daily trendline shown above.
In sum, the first test of the 20 week ma generated a meaningful rally phase.
The bounce off the second test of the 20 week ma has been meager…except for a handful of momentum darlings in memory, disc drives and certain techs.
Specifically, SNDK, LITE, STX, WDC and TER to mention a few.
AMD is suspect having dropped 20 points after reporting Tuesday night.
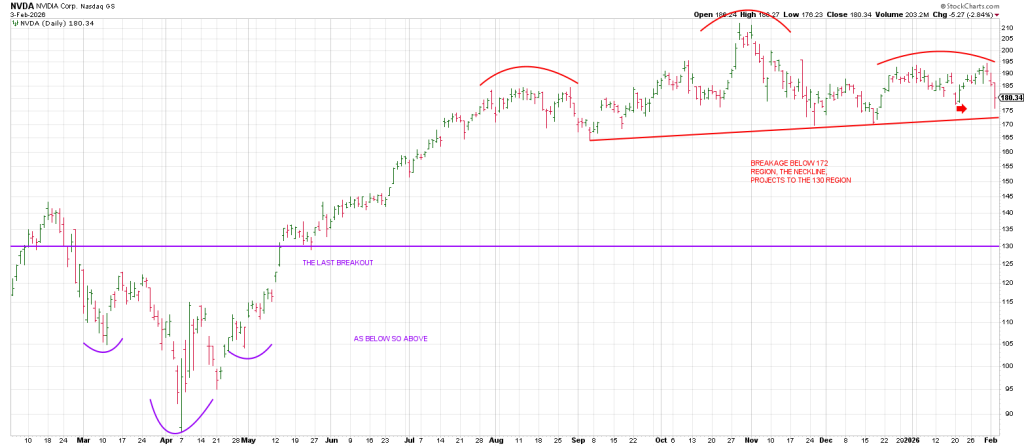
For its part, the Homecoming Queen, NVDA, looks more like Carrie having broken its 50 day line with authority on Tuesday and in the process snapping a Bottoms Line from mid-December.
NVDA’s Head and Shoulders projects to the 130 region.
Monday’s report showed the potential for a Black Monday with the futures down 90 points overnight.
But either the Hand won’t entertain intense selling pressure on a Monday that can erupt into a waterfall ala October 19, 1987 or October 28, 1929 or someone big didn’t get the memo last week, and the market had to be jacked back up after last Thursday’s plunge to give them a graceful exit.
That said, we do have a crash. Software.
MSFT, SNOW, CRM, NET, etc, etc, etc.
The Q’s reflect the ongoing leadership failure within most of technology.
The internal damage was especially notable on the NAZ where 417 issues registered new 12 month lows—an unusually high figure given that the index remains within roughly 3% of its October 29, 2025 all-time high.
The This divergence between price proximity to highs and expanding downside participation reinforces the message that the market’s largest components are now pulling the indexes lower rather than higher. With the Mag 7 accounting for roughly 30% of the NAZ, tgheir weakness continues to dominate overall market direction.
The daily QQQ below shows an LROD, a large range outside down day with a close below the 50 day moving average.
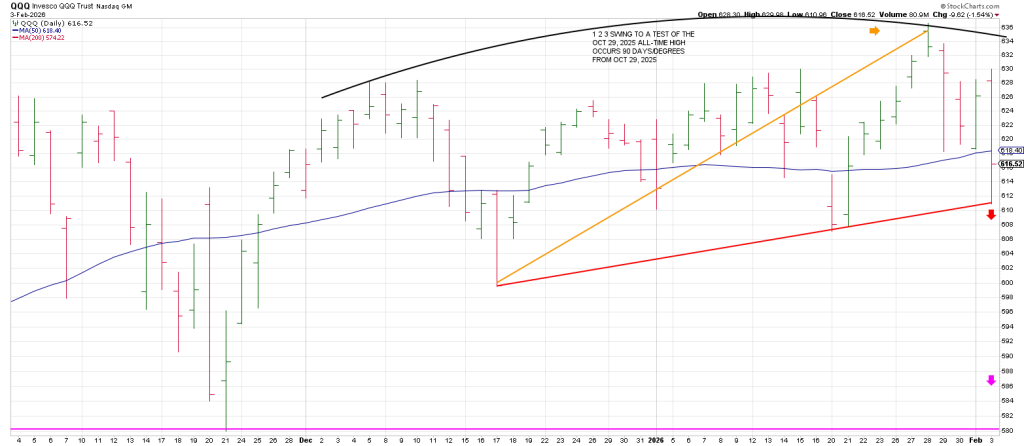
The Q’s are on the edge of a Rule of 4 sell signal.
Trade below Tuesday’s low of 611 will trigger the RO4.
Notice that the downside since last week was produced after a breakout attempt on January 28 which scored a 1 2 3 Swing to a Test of the October 29th high.
Last weeks new high and subsequent roll-over came 90 days/degrees from the October 29 all-time high, underscoring the idea of a Secondary High.
Importantly this is the same pattern on the weekly of the Secondary High on the SPX into early September 2000.
We have a close below the 50 day ma. Remarkably, 90 degrees down from the QQQ January 28 636.60 high is 610.60.
Tuesday’s low was 610.96. A direct hit.
What this means is that breakage below yesterday’s lows should intensify a decline.
The next 90 degree decrement down is 588.
The Roadmap for Wednesday.
Following a little rally attempt into 10:00-10:15 the market rolls over accelerating into 1:00.
A rebound from 1:00 into 2:15 is followed by a pullback into 3:00 and then a retrace into the close.
All in all another strong probability of closing in the red.
If there is going to be an attempt by the SPX to challenge all-time highs it will likely occur on Thursday.
Friday should be a good opportunity to build short positions for next week.