“Everybody knows that the dice are loaded
Everybody rolls with their fingers crossed.” Everybody Knows, Leonard Cohen
“Knowledge of the past is indispensable to understanding and managing the future.” Arthur Zeikel
In markets, not economics, 1987 was an echo of 1929.
1929 is coupled to the Great Depression.
1987 turned out to be a market event, not an economic event.
We know that both of those crashes saw a crescendo around the 56th calendar day from the high.
It got me to thinking, was the 1929 crash a crescendo of something from 56 YEARS prior?
As the Bible says, “a day for a year”.
As it turns out 56 years prior to 1929 was the Panic of 1873.
The Panic of 1873 triggered an economic depression in Europe and North America lasting 4 years.
The first symptoms of the crisis were financial failures in Vienna, Austria.
The Vienna Crash started on May 9, 1873. It is 55.440 days from then to Feb 21, 2025, basically right at the all-time SPX high.
55,440 rounded gives 56.
The U.S. Crash in 1873 occurred on September 20.
55,440 days from Sept 20, 1873 is July 5, 2025.
This is basically directly on the 93rd anniversary of the 1932 Great Depression PRICE low.
In September 1873, following the collapse of Jay Gould, the stock market closed for day days from the September 20th.
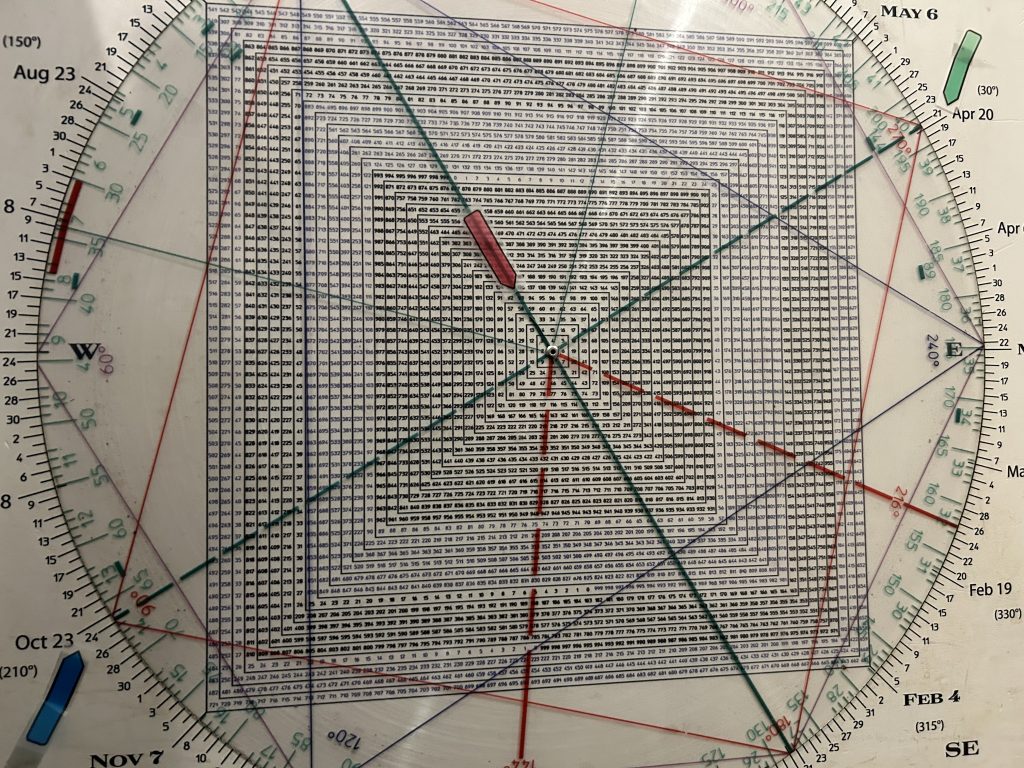
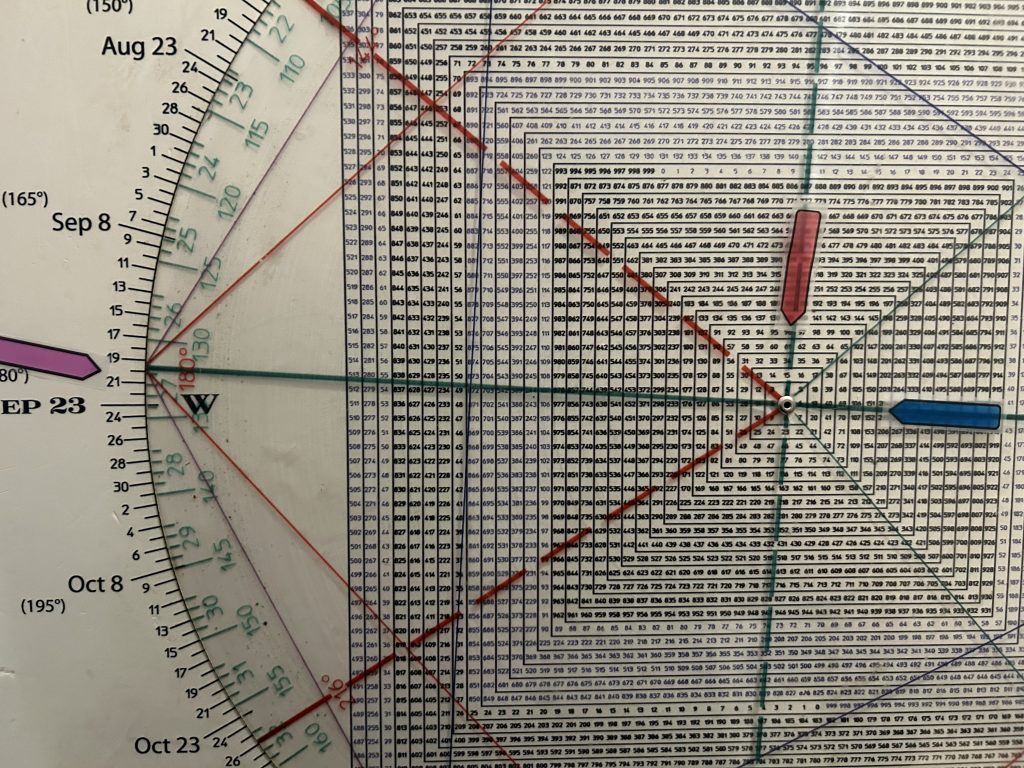
On the Square of 9 Wheel 93 squares-out with Oct 24, the day the air rushed out of the bubble in 1929.
93 also squares out with April 21, Monday’s “test” of the early April low.
At least that’s what the Talented Mr. Market would like us to think.
What better way for a crash to occur than for it to look like a test of a low had been installed and get the Buy the Dippers lathered up about a great buying opportunity?
To wit, a failure of the April 21st low (and the aforesaid square-out with 93/ April 21) to hold would be a
“tariff-fying” point of recognition.
No doubt a slug of shorts have been covered on the 370 point SPX face-ripper since Monday’s low.
No doubt the bargain hunters were out en masse on the notion of a successful test.
Tuesday and Wednesday’s stampede reflects the “get me in at any price” mentality.
What this does of course is make Monday’s low a trap door.
Bulls will be forced to puke up what they devoured this week, while at the same time the market won’t have the benefit of short-covering on another trip down to 5100 Memory Lane.
Is it possible this is what the vibration between April 21st and July 1932 is telegraphing?
—that keen market observers won’t have to wait for the SPX to take out the 4835 April 7 low before downside fireworks—it may only take breakage below Monday, April 21st low to trigger a point of recognition by market participants that it is time to Get Out Of Dodge.
Succinctly, breakage below 5100 which as you will recall from this week’s charts is a 3 point trend line connecting the Oct 2022 low and the Oct 2023 low.
The SPX Jackknifed of this trend line but now a break of this multi-year 3 point trendline threatens May-hem.
As it did in Austria 152 years ago.
Checking the Wheel shows that 152 squares out with 96.
96 years ago is 1929.
Notice how both square September 20th, the 1863 crash in the U.S.
We’re seeing some compelling synergy—too uncomfortably compelling for my taste to be scooping up bargains for the long pull.
For short term swing trades…fine.
From the 1929 crash to the 1987 crash is 58 years.
58 squares out with October 29, the 3rd of the 3 Great Crashes in 1929.
58 also squares out with the DJIA all-time 386 price high and 381 closing high on September 3, 1929.
Working with the Wheel is NOT an exercise in Monday morning quarter-backing.
I think you all have seen that.
Allow me to explain using the above example.
Had you noticed in the summer of 1987 that we were 58 years from 1929 and that 58 squares out with Oct 29 and 386, you might have concluded that a crash may be on the table come October 1987.
Especially as the price pattern in 1987 began to mirror that of 1929.
There are many other synergies between the two crashes that we have shown in this space.
Checking the Sq of 9 Wheel shows that one octave up from 58 is 92.
In other words 92 is one price cycle of 360 degrees up from 58.
2024, (the DJIA all-time high was Dec 4th, 2024) is 92 years from the low of the century—1932.
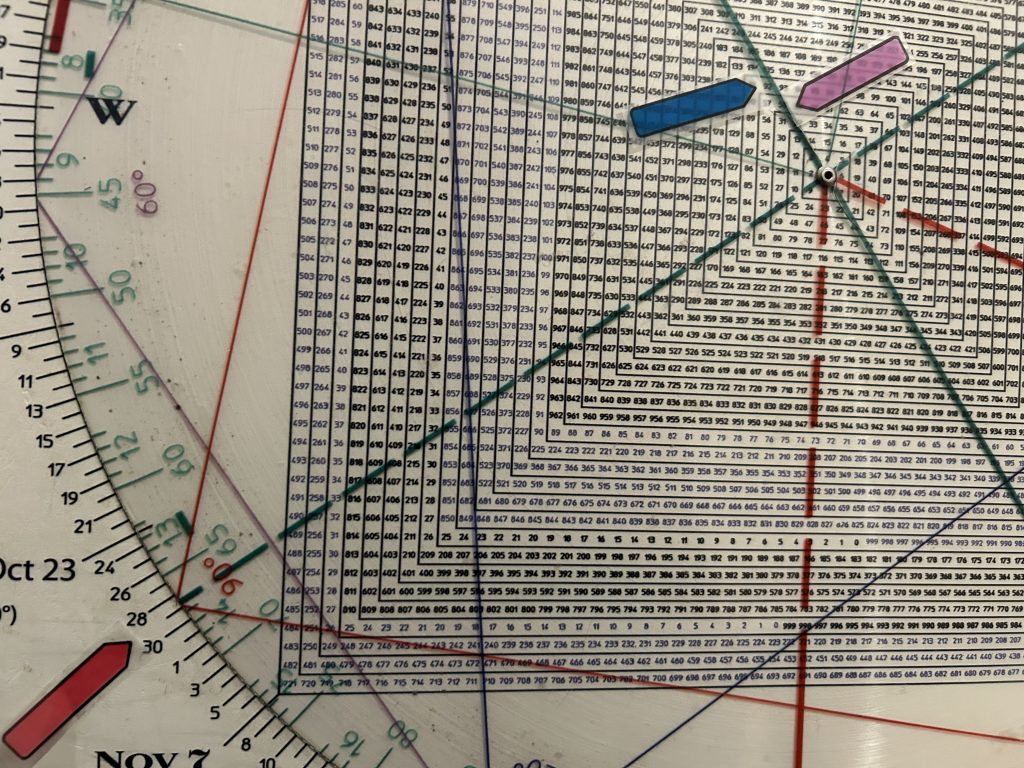
We know that 58 and therefore 92 square October 29.
They also square April 26…this Saturday.
If the market makes a high on Friday or Monday and rolls over caution is warranted.
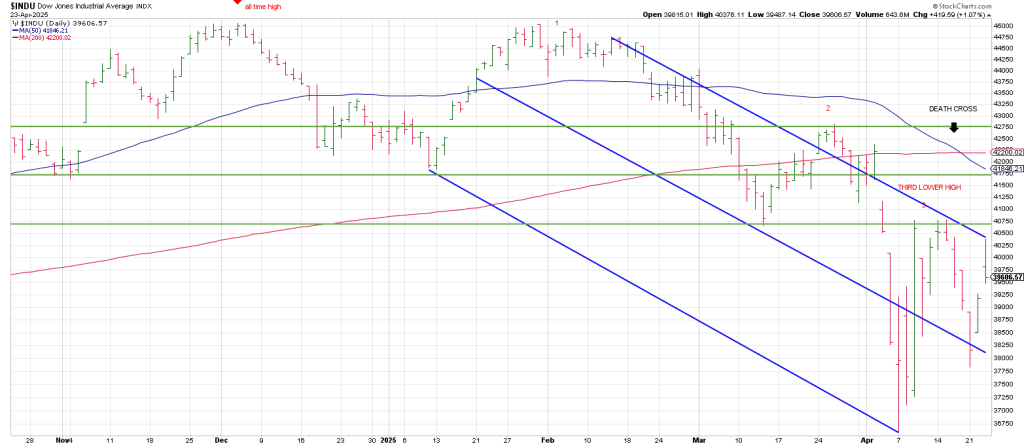
Notice that the DJIA all-time high is Dec 4th.
It is working on a possible 3rd lower high from which fast declines often play out.
Early June is 90 days/degrees out.
Early SEPTEMBER is 180 days/degrees out.
Often times trade wars end up in real wars.
There is lots of speculation in Asia over an invasion of Taiwan.
Apparently ocean tides favor months of April and October.
China makes the world dependent on it so it makes it extremely difficult to retaliate against China if and when it comes.
“And everybody knows that you’re in trouble
Everybody knows what you’ve been through
From the bloody cross on top of Calvary
To the beach of Malibu
Everybody knows it’s coming apart
Take one last look at this Sacred Heart
Before it blows
Everybody knows.”