“Eight miles high, and when you touch down
You’ll find that it’s stranger than know
Signs in the street, that say where you’re going
Are somewhere just being their own. Eight Miles High, The Byrds
Today’s report is short and to the point.
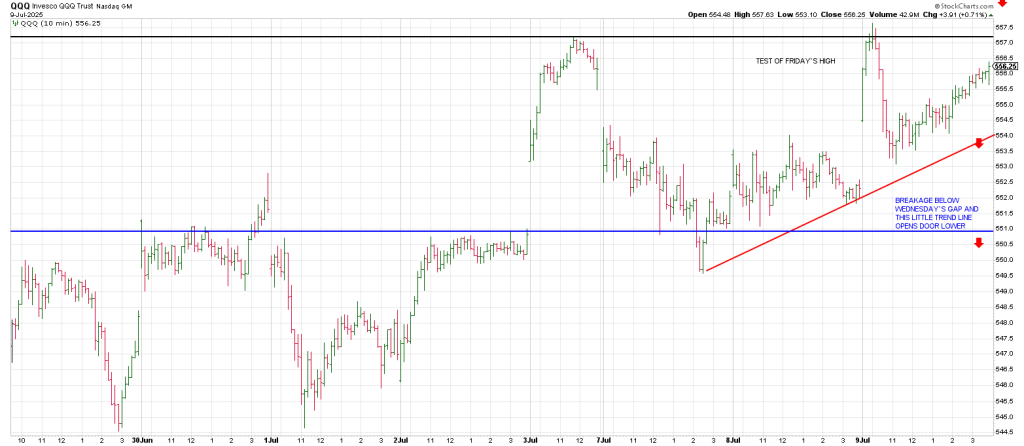
If Friday was a meaningful high. Then it follows that yesterday was a test of that high.
A 10 minute QQQ shows the test on a Spike & Reversal pattern.
No one thinks major move to the downside is on the table.
Even the bears think a “normal” pullback is likely.
Full moons, like today, often mark highs.
Stocks have been backing and filling following Friday’s high.
Unless there is a break in an historic pattern then we should soon witness a major move.
Because the market has been vertical, the likelihood is the move is sharply to the downside.
My style has always been to look for a cluster of events/cycles.
When these occur, action is more likely than not.
Could it be the Big Kahuna?
It could but I think it is a warm up not the big one.
The 3 largest historic crashes in history involve the configuration of Rahu, the North Node of the Moon.
9/14/01. 9/11 was 3 days prior.
10/12/87. Black Monday was 1 week later.
10/24/29. The day the Great Crash started in 1929.
This configuration with the North Node exists now until the end of July.
There are other examples such as
May 2008
June thru July 2011
May to November 2018. The market crashed from September 21, 2018 high.
February to MARCH 21, 2020. No comment necessary.
December thro January 2022, the market crashed from Jan 4 into Feb 24 and 3/29 into June 1.
Oct 2023, the Market crashed from Oct 17 into October 27.
The statistical odds that this was due to chance is very low.
A word of caution.
The T Rex in the ointment is that not all these Rahu hard angle aspects will produce crashes, but when crashes occur, they seem to be involved.
The purpose of this is not to make anyone fearful and no one should depend on a crash to make money and they should not trade on this information alone.
But, the ingredients for a crash are present.
Tomorrow’s report will go into the potential for a geo-cosmic Black Swan event versus a geo-political.
More than 400 earthquakes just shook Mr. Rainier in Washington State on Tuesday.
1,300 earthquakes have struck Japan islands in the last two weeks.
The Ring of Fire it would seem is getting active.
I think this underscores the Rahu cycle.
The universe is synchronous.
The 25 year/50 year Jubilee Cycle is in focus.
We are 25 years from the 2000 Bubble Top.
It was 25 years from the December 1974 low to the early 2000 top.
It was 50 years from the 1932 low to the 1982 low.
The Primary High in 2007 was on July 19.
That is 18 years ago.
The Rahu cycle is an 18 year cycle.
I will do the charts on MSFT and NVDA in tomorrow’s report as I wanted to get the above information out there.
Suffice to say that MSFT bottomed at 345 in April and 2 revolutions of 360 degrees up is 510.
NVDA bottomed at 87 in April. The upside pivot is 164 which squares 87.