Providing market timing and long/short swing trades and day trades since 1996
Luna Tick Month
September 9, 2024 •
Jeff Cooper
“Mr. Moonlight You came to me one summer night And from your beam, you made my dream”, Mr. Moonlight, The Beatles
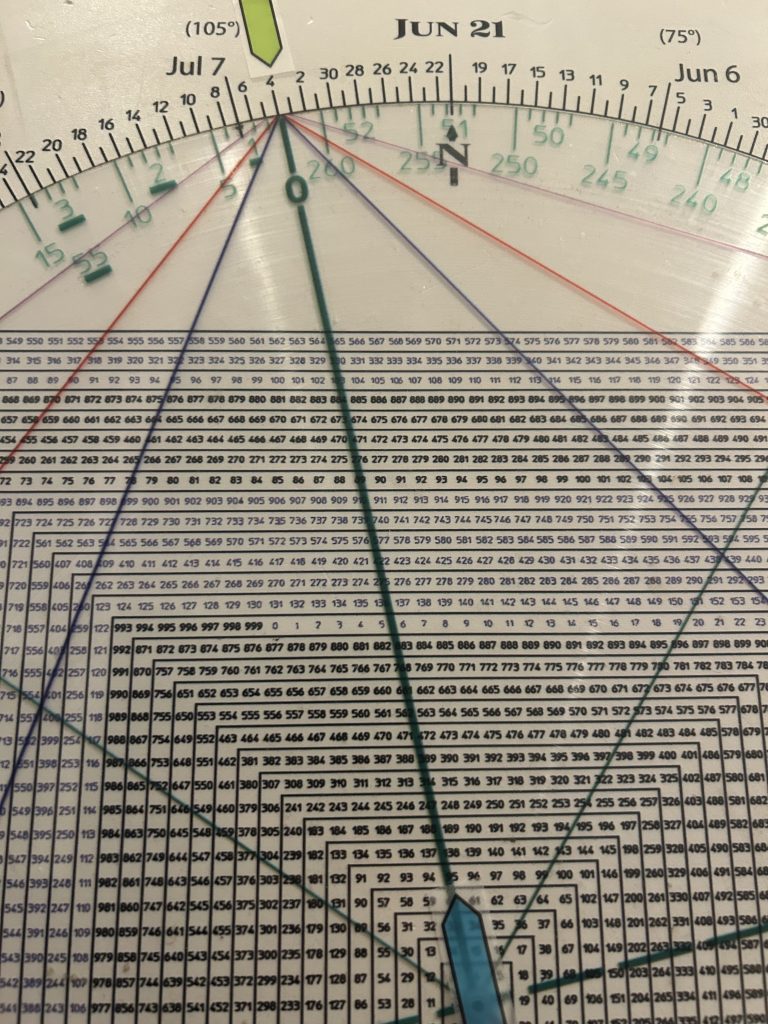
This September shapes up as a September to remember. Why? This September is the 95th anniversary of the 1929 crash. On the Square of 9 Wheel, 95 “points to” July 4th, the U.S. birthday.
So what you say. What’s the big deal? Obviously a lot of anniversaries have come and gone since the Declaration of Independence. However, we are currently 247/248 years from 1776. Notice on the Square of 9 image above the synchronicity with 247/248 also pointing to July 4th.
We wrote the above in the June 3rd Hit and Run report, A September To Remember.
Is it possible that the 2 1/2 + year cycle encompassing the decline from the 1929 top to the 1932 low marking a 100 year bottom is mirrored by the 2 1/2 plus period from the late 2021/early 2022 top to the summer of 2024 marking a 100 year top?
For those who are not long time subscribers, my name is Jeff Cooper. After a stint at the famous Beverly Hills Drexel Burnham office, I went to work for my dad’s hedge fund. Since 1996 when I started my hit and Run newsletter, I have made a career for myself forecasting and trading precise movements of the markets.
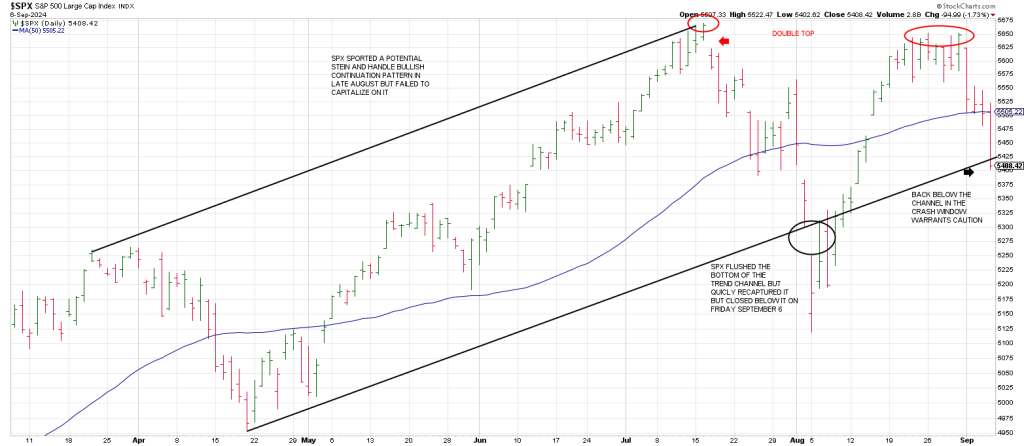
In April 2024, I told subscribers that I thought a rally mirroring the 13 week blow-offs in 1929 and 187 would play out into mid-July. The SPX topped on July 16th,
In fact right off the high day (which was virtually a high-tick close), the SPX had a Breakaway Gap to the downside. That’s never a good sign—especially when you get downside follow thru. We did. The SPX satisfied our expectation for a Flash Crash from late July to early August.
The early August crash flushed the bottom of a trend channel from April thru July. The trend channel was quickly recaptured perpetuating a drive to test the all-time highs. However, the bulls snatched defeat from the jaws of victory: the promise of a Stein and Handle pattern was thwarted last week with a plunge below the 50 day line. Moreover, the SPX closed below the trend channel on the Friday weekly closing basis. The sharp sell-off from a test of the July ATH suggests that was indeed a 13 week blow-off top mirroring 1929 and 1987’s last ditch runs. The angle of attack decline following a test of the July peak suggests late August was a Secondary Top. That makes the action this week critical as we are in the heart of Gann’s Crash Window on the SPX.
In addition to market timing, Hit and Run seeks to capitalize on both sides of the market with swing trades and day trades.
Our readers have had consistent opportunities to profit both long and short during the August Plunge & Surge. This is in keeping with the market maxim that some of the biggest long side winners come in a downtrend and some of the biggest short side winners come in an uptrend. This is because vicious rallies can play out in the midst bear phases and sharp shakeouts can occur in the midst of raging bulls.
Here’s what some of our subscribers have said:
“I’ve been investing for over 42 years and I’ve never seen anyone who can call the short term turns as well as the major tops and bottoms with such accuracy.” Robert Farrell
“Thank you for the incredible service and help you provide and the patience you show your subscribers. God bless you for the amazing and wonderful work you do.” Lalit Mirchandani
“Not only have you made great calls but provided one of the best market insights to understand how the market moves.” Vijay Thatte
“I have never found any others as prescient and key as what you provide, teach and share…always indebted you your work and insight. Much thanks!” Bob Hanss
“The Square of 9 Wheel is a priceless tool. Learn to use it by putting in the time and you’ll reap the benefits.” Bryan
“Jeff…terrific analysis by you…will be giving props on my radio show today.” Gary Kaltbaum
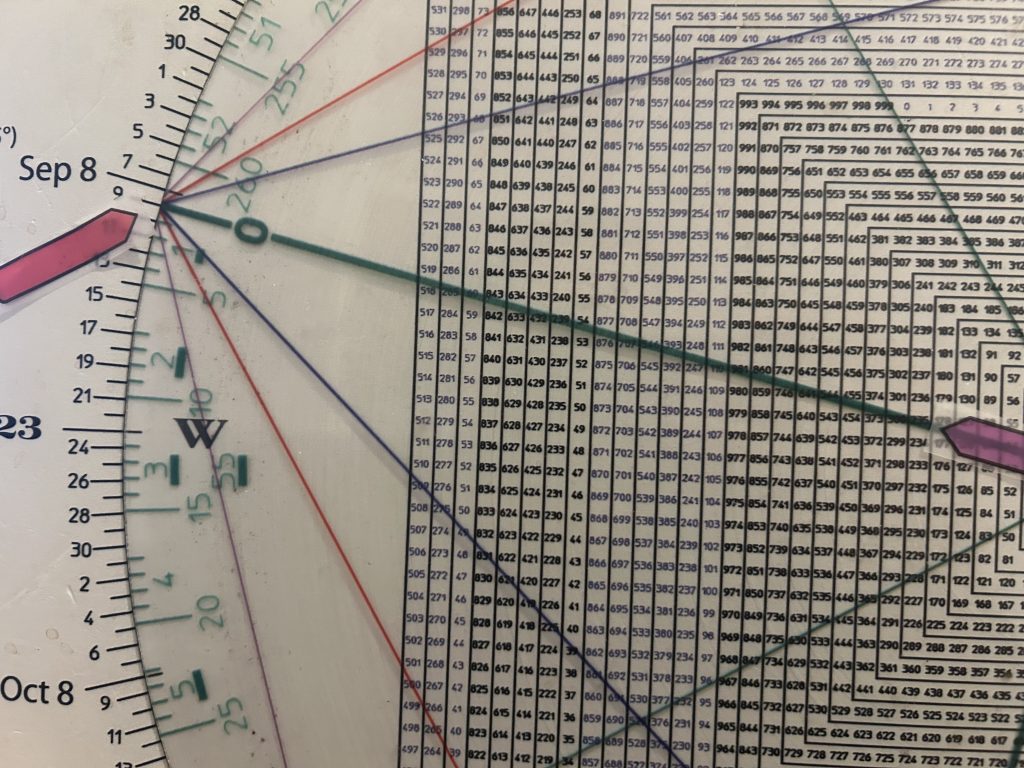
Above I mentioned that we are in the 95 year cycle from 1929 and in the heart of the Gann Crash Window which ties to two months from the high.
All sell signals must be taken during crash windows. Early last week we flagged a drop to 5373. This is because 5373 satisfies a 360 degree decline from the all-time high. On Friday the index struck a low of 5402 in the context of a continuation sell signal—an Expansion Pivot Sell…a large range break of the 50 day moving average. On August 1st an Expansion Pivot Sell signal elicited 2 more large down days.
What is interesting about that is that September 9th and 10th are synchronous with waterfall declines on October 28th and 29th, 1929.
While that does not necessarily mean a swan dive is on the table early this week, caution is warranted as to trying to catch falling daggers.
The Metonic Cycle is why Sept 9th and 10th are synchronous with October 28th and 29th, 1929—aside from the fact that they both tie to the Gann Crash Window.
The Metonic Cycle is a period of 19 years in which there are 235 lunations or synodic months after which the Moon’s phases recur on the same days of the solar year or year of the seasons.
That means that September 3rd, 2024 was a Tuesday, just as was this year.
The crashes on September 28th and 29th were Monday and Tuesday on the Gann Crash Window. Monday and Tuesday this week align with the cycle.
Above we mentioned the Metonic Cycle is 19 years or 235 lunations.
We are 95 years from the fall of 1929. 95 divided by 19 is 5. We are 5 Metonic “Waves” from 1929, potentially culminating a major Super Cycle Top of 5 major Elliott Waves
As well 235 (as in 235 lunations) aligns/points to September 9th.
On the two days, October 28th and 29th, 1929 the DJIA fell roughly 25% Interestingly a 25% decline in the SPX from Friday’s close gives 4056. This ties to the October 2023 low. If the back of the parabolic advance from 2023 has been broken, as it certainly appears by virtue of the action in tech, then the presumption is an unwind to the 4100 region is on the table Broken parabolas return to their point of origin.
In sum, whatever happens in September, November sets up for a potentially more dramatic sell-off. Tomorrow’s Hit and Run will walk thru two major cycles that I’m looking at that look to exert their influence.
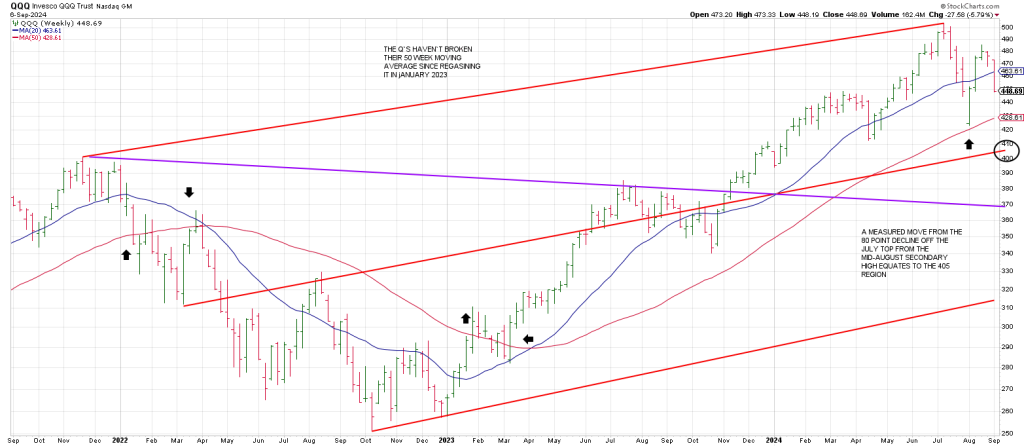
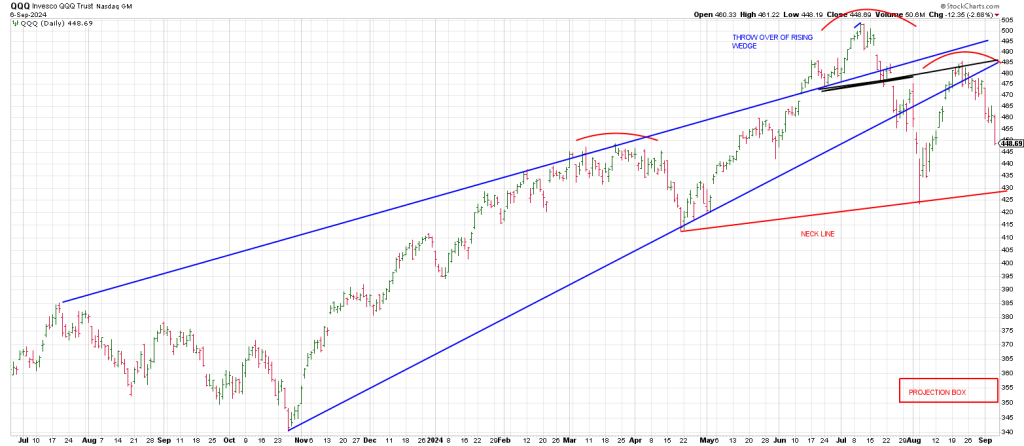
Checking a weekly QQQ shows a mid-channel line at 405 region. From the 503 high a drop to 417 satisfies a 360 degree decline. This also ties to a Measured move from the Wave down from July to August.
Notice a Ghost Line points comes in this fall at the 370 region which equates to a 540 degree cube down off the QQQ record high.
A failure below 370 opens the door to downside acceleration to the 315 region and the bottom of the trend channel.
Checking the daily Q’s shows a Head and Shoulder projection to the 355 region.
Notice the Throw-Over that installed the Head of a presumed Head and Shoulders Top. An Ascending Wedge was broken in August followed by a backtest of the Wedge. The ensuing downside price action is conspicuously bearish.
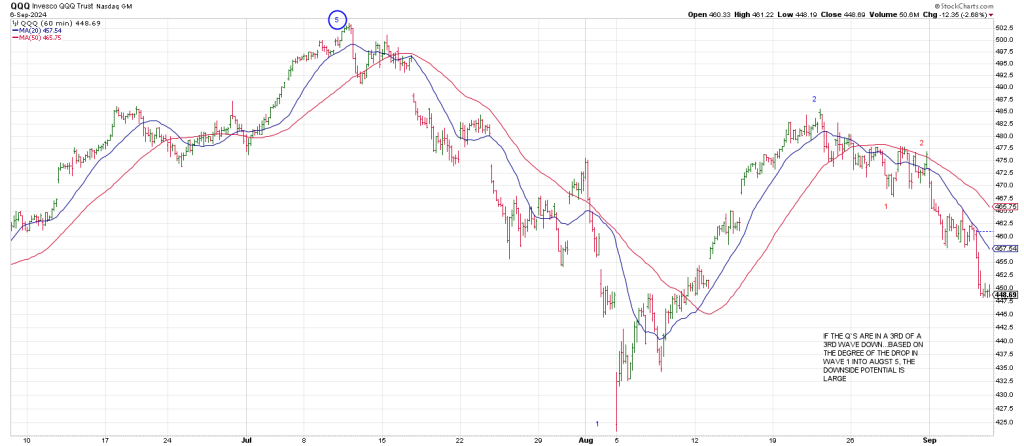
An hourly QQQ supports the bearish interpretation. The decline from the July high looks impulsive (5 waves) while the rally from August 5th looks corrective (3 waves).
If the Q’s are in a 3rd of a 3rd wave down, then based on the degree of the drop in Wave 1 into August 5th, the downside potential is large.
As always, follow thru is key. If the market doesn’t follow thru to the downside, it is possible it rallies into Sept 11- 13th since 567 (5670) squares late this week.
As well, we need to be mindful that up opens after large sell days are typically not the stuff of reversals. By definition a down open after a large sell day sets up an upside reversal.