“Down, dooby-doo, down-down
Breaking up is hard to do” Breaking Up Is Hard To Do, Neil Sedaka
The volatility telegraphed by Wednesday’s NR 7 Day riddled the tape yesterday.
Drilling down to a 10 min SPX shows a drop from the opening bell followed by a rally to a new high for the move off the April 7 low and a reversal carrying through to the close.
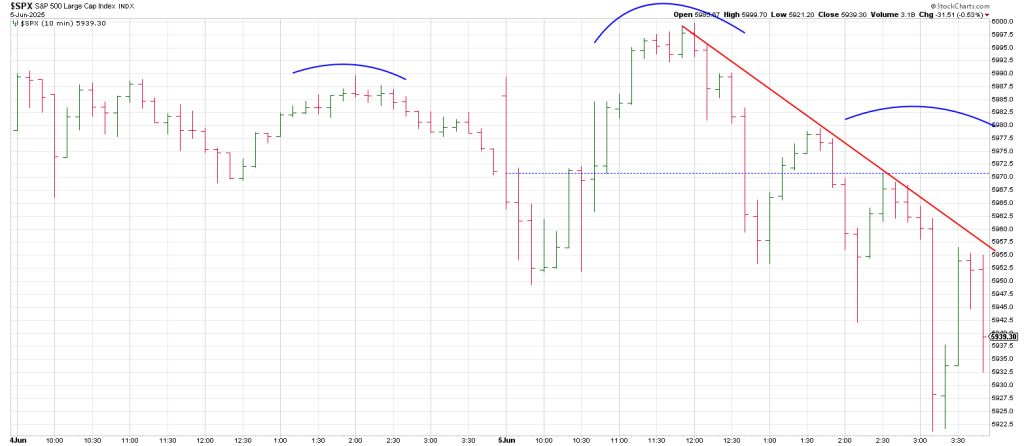
The Roadmap indicated an early low followed by a high for the day at 11:45.
We got an early low with a high for the day hitting at 12:00.
The roadmap projected for a stair-step decline into the close.
Markets stumbled even before the heated exchange between Elon Musk and Donald Trump broke.
The war of the words rattled investor confidence accelerating late-session selling with the DJIA losing 108 points, the SPX shedding 32 and the NAZ tumbling 162.
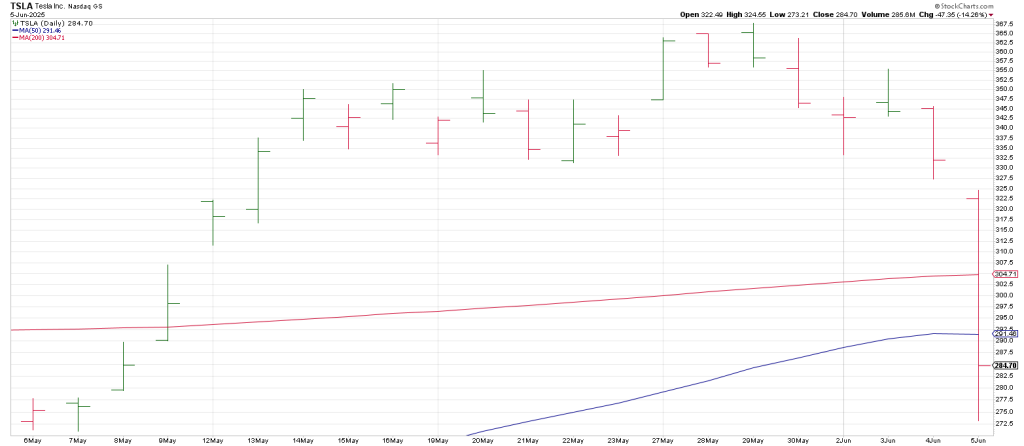
TSLA crashed. It exceeded a 360 degree move down from its 367 May 29th high.
360 degrees down is 294. TSLA skidded to 273…not just a nominal undercut.
Market internals reflected the deterioration: NYSE net advances were a meager 24, while the NAZ saw a striking 901 net declines—a breadth reading consistent with a bona fide reversal and risk aversion.
As I write Thursday night futures are up in contrast to the SPX’s Key Reversal Day.
But this morning brings the week’s pivotal moment. The monthly Nonfarm Payrolls (NFP), due at 8:30 AM.
It is expected to bring clarity to the state of the labor market and broader economic trajectory.
The likelihood is the report holds the key to the market’s next meaningful move.
A daily SPY shows the 590 level is pivotal.
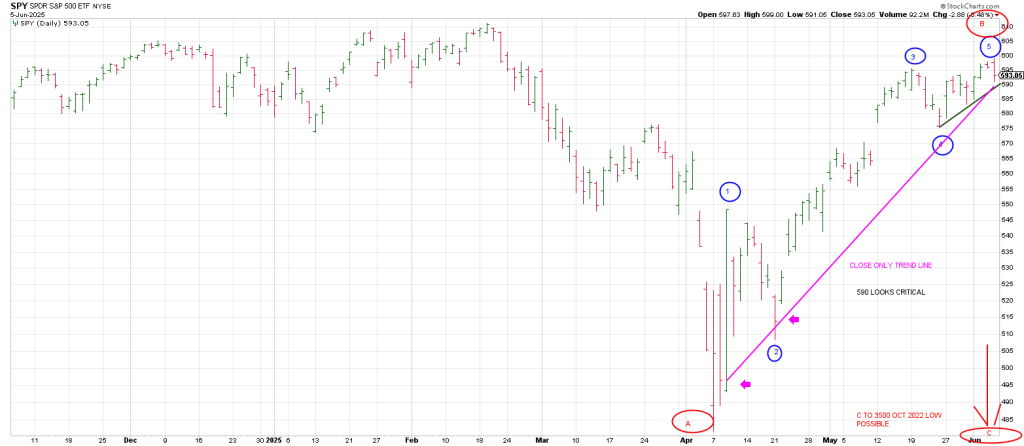
The green trend line connects the lows from the May 23rd test of the 200 day moving average.
The magenta line is a close only trendline off the April low. it bisects the 590 level as well in this time frame.
Downside follow thru today confirms Thursday’s Soul Nazi sell signal on the important Friday weekly closing basis.
As you know this reversal is pushing the edge of the Gann Panic Window, of 7 to 8 weeks, but importantly, downside follow thru below 590 suggests 5 waves up from the April low is complete.
There are two primary wave counts.
The first is that the drop into April is an A Wave and the current rally a corrective B Wave.
If so, the ensuing decline will be a dramatic C wave decline. C waves are vicious.
The potential for a C Wave decline is 3500 SPX, a test of the October 2022 low.
The second count is this 5 wave is part of a bullish structure and following a meaningful pullback the door will be open to new all time highs.
In either instance a decline from this area will be deep.
Pulling back the lens to where the advance prior to the February top started in October 2023 shows the SPY has returned to the scene of the crime.
This is where the black Bottoms Line was broken in February.
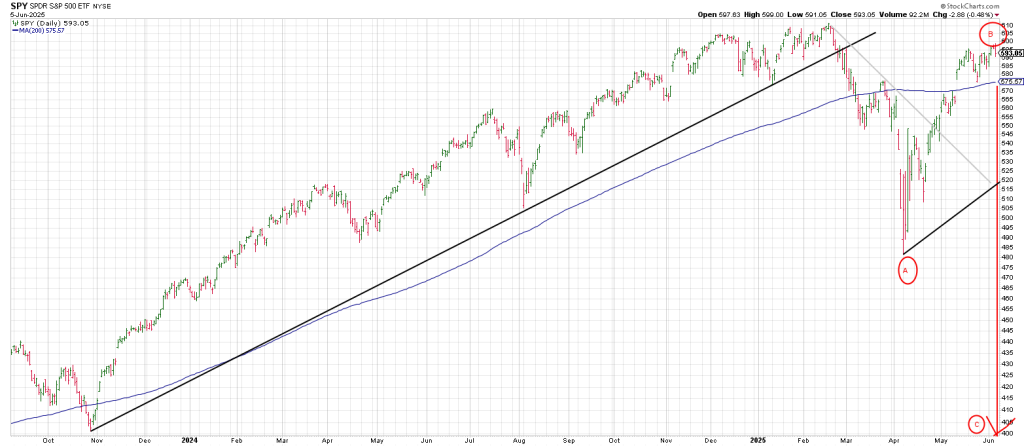
From the black Bottoms Line that defines the advance from Oct 2023. I paralleled a line off the April 2025 low.
That line comes in at 520 (5200) over the next month.
I also drew a trend line connecting the Feb high and the March high. it bisects the lower black channel line in the same 520 region.
The takeaway is that even a bullish pullback could see a drop to as low as 5200.
To recap, breakage below 590 opens the door lower.
Downside follow thru below the 200 day moving average and the big Phil D Gap from May 12th confirms a top of some degree.
In sum, downside acceleration suggests that the mid-June (+ or – a week) turning point is probably a low, not a high a seemed a stronger likelihood just days ago.
The Roadmap for today is looking for a decline from the open into 10:30 a rally attempt into 11:00 ish and another
Drop into a 12:00 to 12:30 base that produces a rally into 1:15
From there a rug pull is projected into 3:00 with the market going flat into the close.
There is a possible Inversion Pivot at 12:45, which if it takes hold may turn the market down prior to the idealized
1:15 turning point.