A Key Reversal Day is a new 52 week high with a close below the prior day’s low.
So it is not just a outside down day but requires a close below the prior day’s low.
It’s not as common as you’d think.
When is the last time the SPX registered one?
It wasn’t at the February 2025 top.
We got one on December 20, 2023.
It did not produce a decline.
The SPX went sideways for a month and then broke out.
We got one on May 23, 2024.
It produced a meagre pullback for 5 days then the market blasted off.
We got one on July 11, 2024, the market traded sideways for 3 days followed by a Breakaway Gap to the downside which produced a Flash Crash into August 5th.
Interestingly the July 2024 signal was also a Key Reversal Week.
In other words, the two KRD’s in 2024 were offset in short order triggering Keyser Soze buy signals…Reversals of Reversals.
However, there was a Key Reversal day almost exactly 2 years ago on July 27, 2023.
720 degrees/days ago.
It telegraphed a 500 point SPX decline into October 2023.
The point is it is not the signal in and of itself, but the ensuing behavior, that tells the tale of the tape.
This is the secret sauce of all technical analysis.
Succinctly, Follow Thru Is Key.
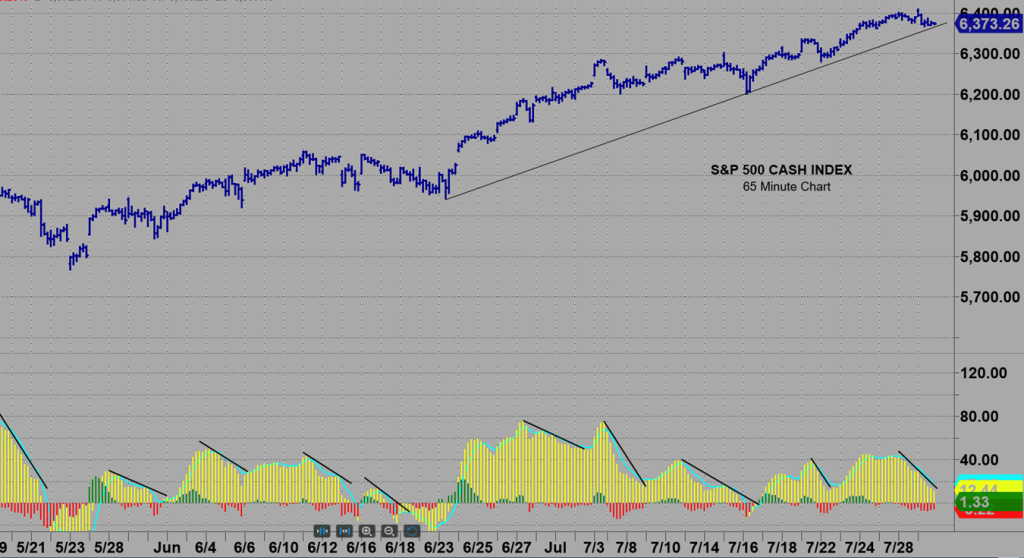
An hourly SPX shows that downside follow thru from Turnaround Tuesday’s KRD will trigger breakage of a 3 point trend line, a Rule of 4 Sell signal.
Pulling back the lens to see the dailies shows that downside follow thru would break a mini Ascending Wedge.
Breaks of Ascending Wedges can be violent.
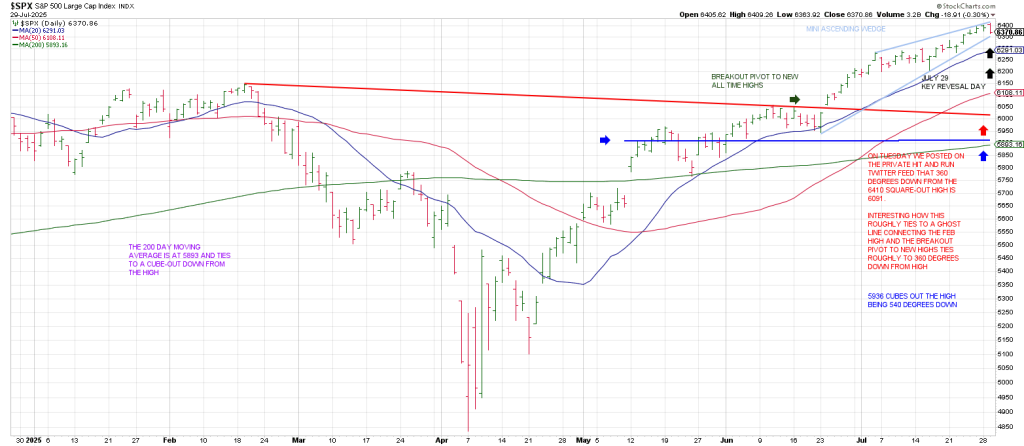
90 degrees down from Tuesday’s 6409 high is 6323 with the 20 dma just below at 6291.
The 20 dma hasn’t been violated since it was reclaimed on April 24th…90 days/degrees ago.
180 degrees down = 6249.
270 degrees down = 6170.
360 degrees down = 6091.
6091 roughly ties to a Ghost Line connecting the Feb high and the breakout pivot to new highs.
A full 540 degree cube down from the high is 5936 which ties to a test of the 200 day moving average.
It was a bullish pullback to the 200 dma on May 23rd that set up the run to new all-time highs.
If we get downside follow thru, it should be easy to tell if the 200 day is in the cross-hairs.
Why? Because the SPX has to break below the 50 day line and the aforesaid Ghost Line to get to the 200 dma.
Interestingly the July 27, 2023 Key Reversal Day did not see immediate carnage.
The SPX traded inside for 3 days before a Breakaway Gap opened the down door.
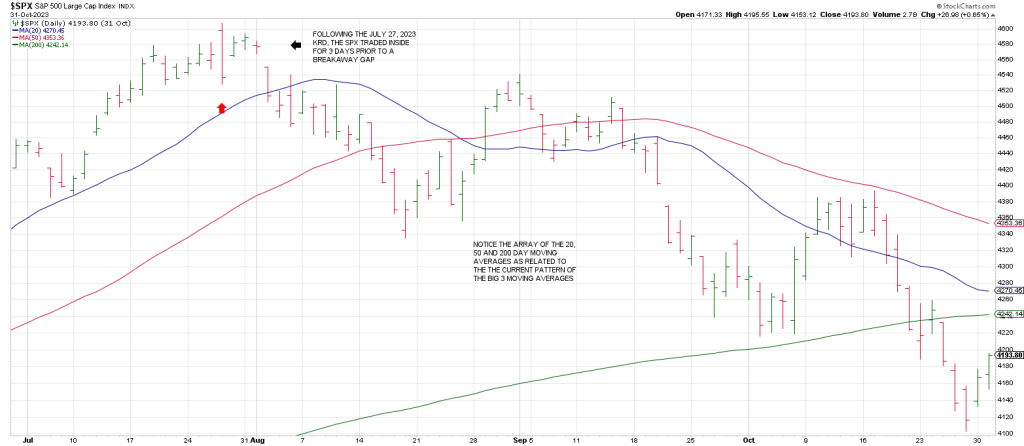
The 3 day sideways stint frog-boiled technicians addicted to immediate complacency.
If the wings have been clipped off this high-flyer market for the moment, and the Key Reversal Day is going to define
A downturn, It’s hard to envision 3 quiet days on the side here with today being Fed Day and Friday being Jobs Day.
That and the fact that Tuesday’s high satisfied our square-out with the 2009 low:
641 is opposite March 6, the low from 2009.
641 squares 667 the price low on March 6, 2009.