“Well, I woke up this morning and I got myself a beer
The futures uncertain and the end is always near.” Roadhouse Blues, The Doors
Speculating is different than investing.
When we’re speculating, we’re predicting.
In order to predict an outcome in the market, by definition, you’d better not believe markets are random.
Indeed, my belief is that the market is deterministic and ordered.
As such it is geometrical.
Allow me to explain and pull back the veil and lift the kimono a little.
For example the spring low on April 19th was approximately 180 days/degrees from the important October 27th, 2023 low. That low in turn was approximately 360 days/degrees from the October 13th, 2022 major low.
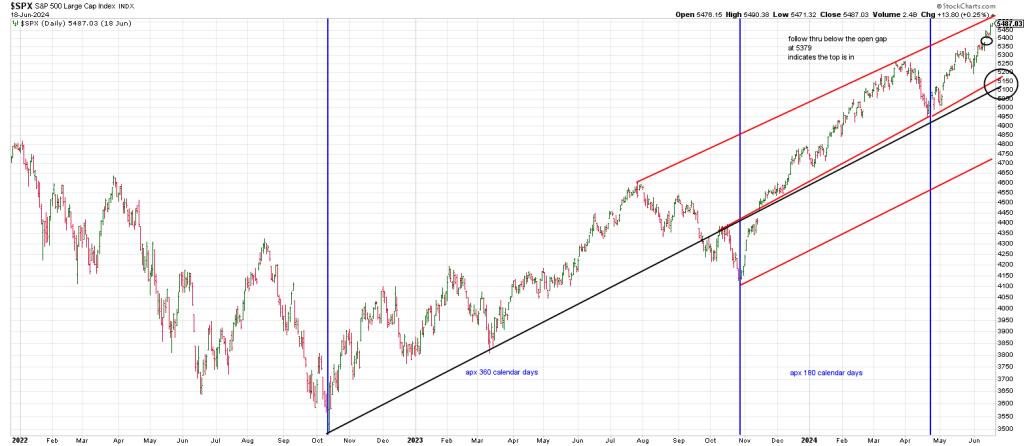
The market isn’t a Rolex. Cycles can be off by days and a few weeks.
Cycles are elliptical and consist of left and right translation. In other words, they can hit a little early or a little late.
Typically, that means 1 to 4 weeks. That’s pretty good when you’re working with months and years.
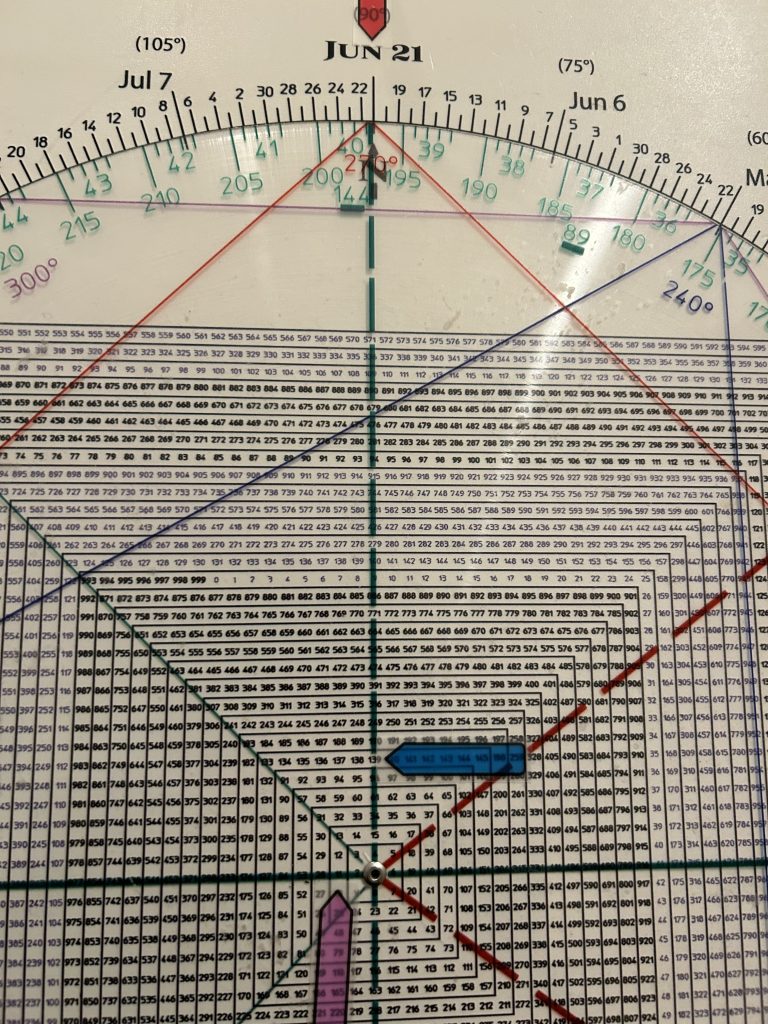
What’s remarkable is that the April 19th SPX low of 4953 (495) is precisely 360 degrees in price up from the 4104 (410) October 27, 2022 low.
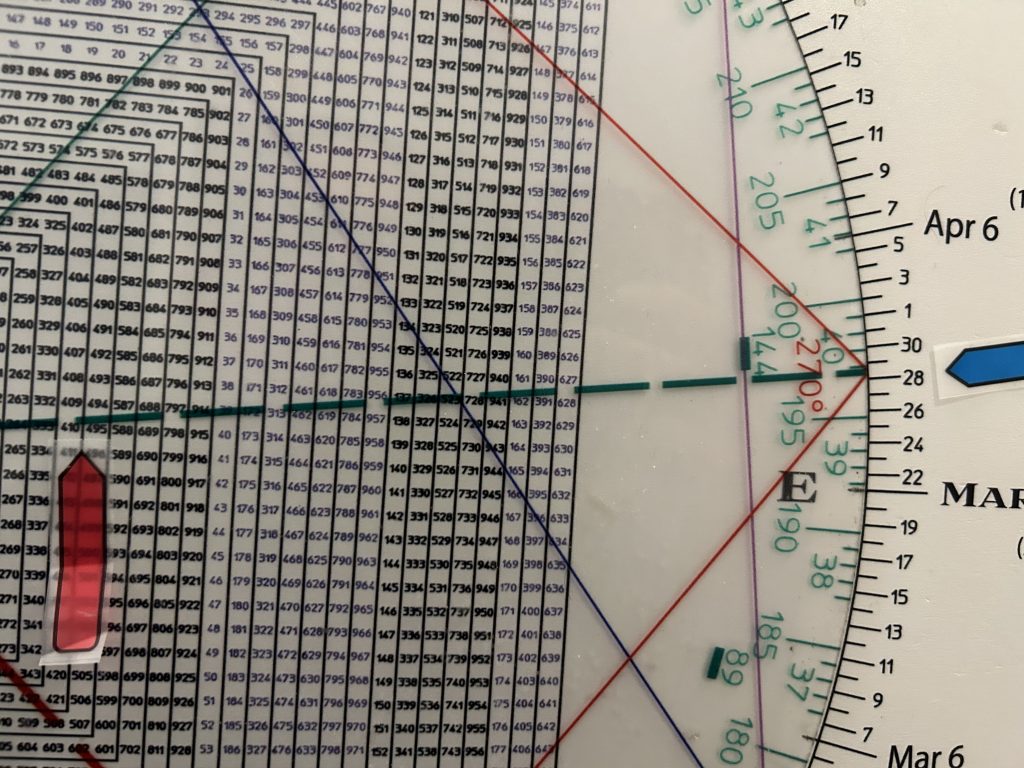
Above is an image from my Square of 9 Time & Price Calculator.
Notice the red arrow pointing to the numbers 410 and 495.
495 is exactly one full square or 360 degree revolution up from 410.
Moreover notice that the square-out with March 28th, the Spring high prior to the drop into April 19th.
So the April 19th low is 180 degrees in time (roughly) from the October low and the April 19th low is precisely 360 degrees up in price from the 410 October 2023 low.
This is a Time and Price square-out.
The SPX has been in a Runaway Move/Blowoff off that “perfected” April low.
The geometry of the low produced a powerful advance.
“If we wish to avert failure in speculation we must deal with causes. Everything in existence is based on exact proportion and perfect relationship. There is no chance in nature because mathematical principles of the highest order lie at the foundation of all things. Faraday said: ‘There is nothing in the Universe but mathematical points of force.’” W.D. Gann
When the SPX 50 day moving was recaptured on May 6th and then it acted as support on a backtest on May 31st it signaled the market would extend into June 21st / June24…at least.
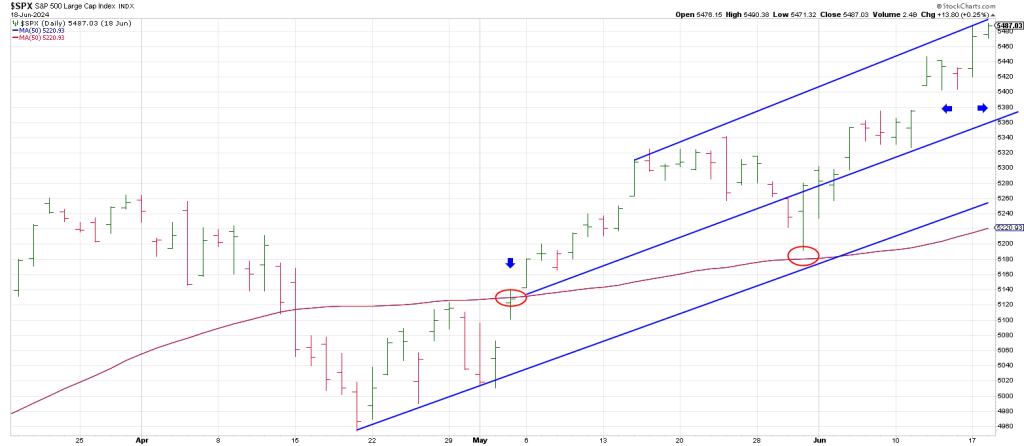
Why June 21-24?
In the last report, we detailed the last ditch rally of 16 trading days in 1929.
The 16th trading day from the shakeout low on May 31st (which is analogous to the shakeout low
Prior to the final surge in 1929) is Monday, June 24.
However, this Friday’s last monthly Opex of the 2nd quarter will exert a powerful influence.
While many money managers desire to see prices extend into quarter-end and clearly some are being dragged into chasing tech names for performance considerations, some may break ranks and cut and run and skip out the door early.
Indeed I was told of such a strategy by a buddy of mine who used to be a trader at one of the biggest mutual funds.
The fund would promiscuously start buying some of their favorite names in the weeks before quarter-end.
This served to make their competition chase the same names.
Then, a week or so before quarter-end the fund would start to indiscriminately hit the bid on these same stocks they had pushed higher.
This caught their competition wrong-footed, thinking the coast was clear until at least the new quarter.
In turn, they started to sell so as not to see their performance suffer.
The entire strategy of triggering their competition to chase and then turning on a dime and catching them by surprise and damaging their performance at the last minute gave the mutual fund who pulled the playbook several percentage points of octane performance above many other funds by comparison.
Could this be part and parcel of the stampede since May 31st?
Well, if the plug gets pulled into quarter-end it may very well be the case.
Names emblematic of this quarter-end window-dressing for the ages are:
MU
TSM
QCOM
AMAT
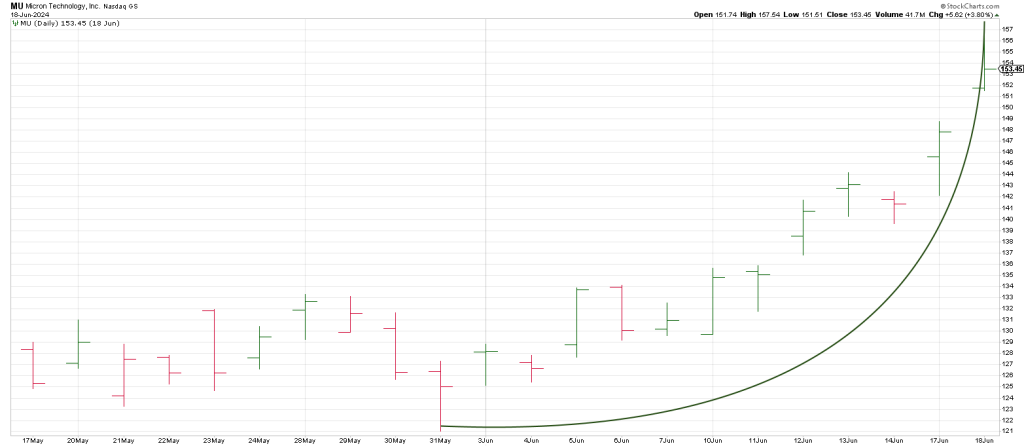
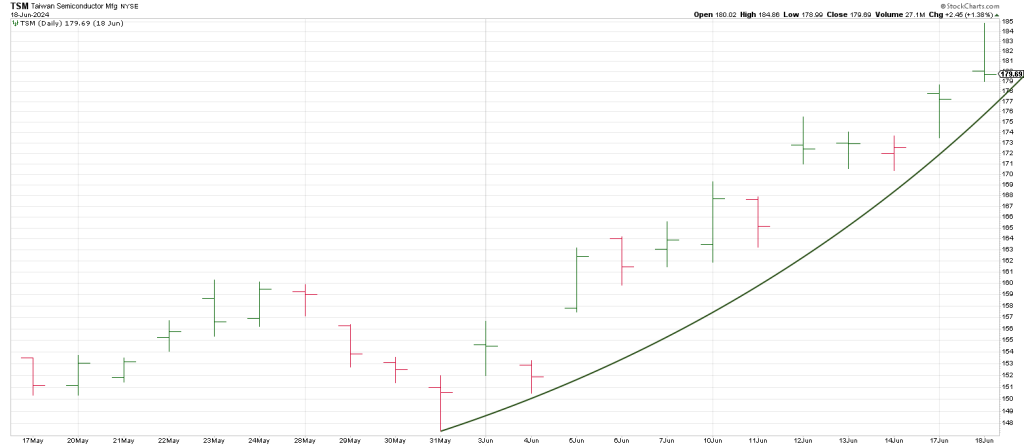
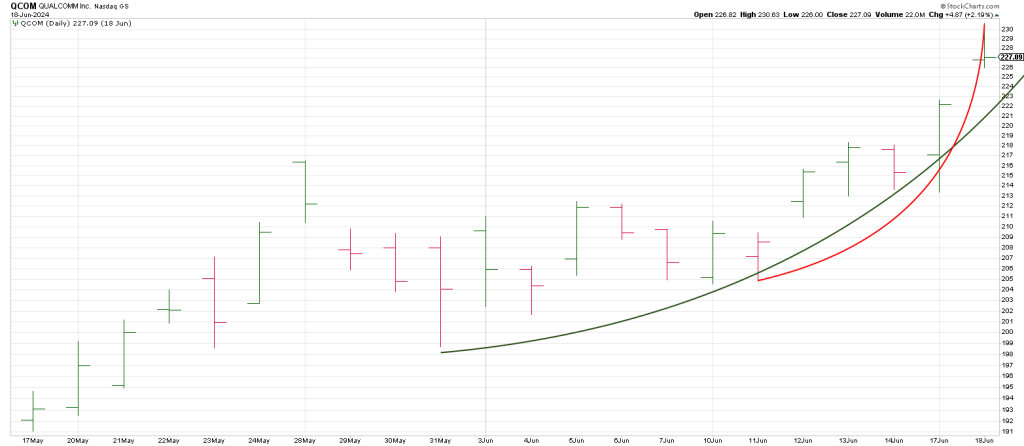
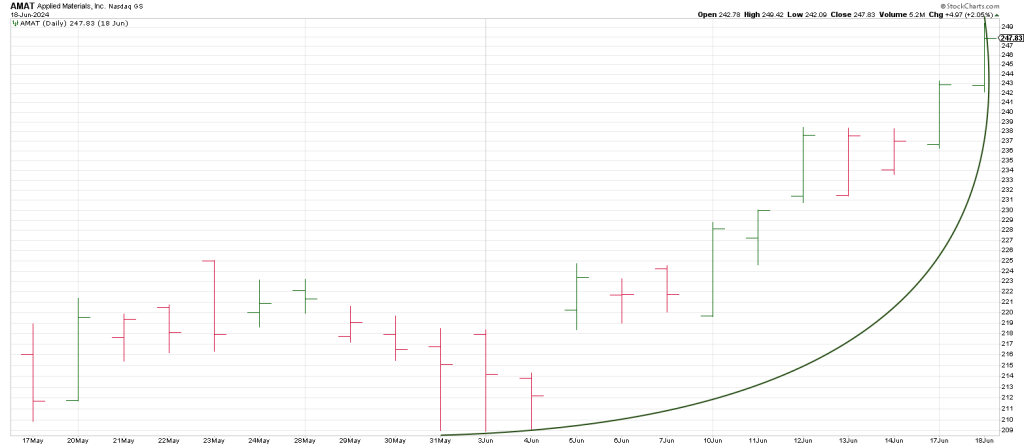
Semi-conductors are orchestrating the performance.
And The Maestro is NVDA.
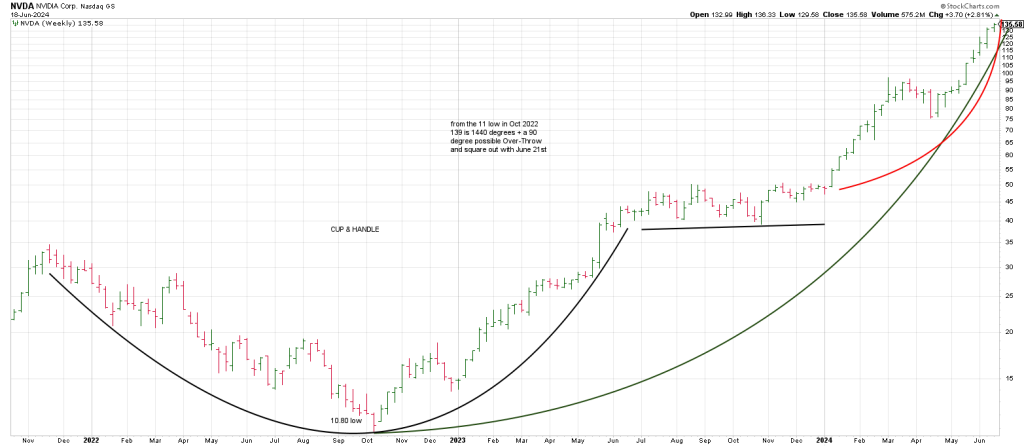
A weekly NVDA shows it struck a low of 10.80 in October 2022. Rounding to 11 we see that 139 is 1440 degrees + a possible 90 degree Over-Throw up and square-out with June 21st.
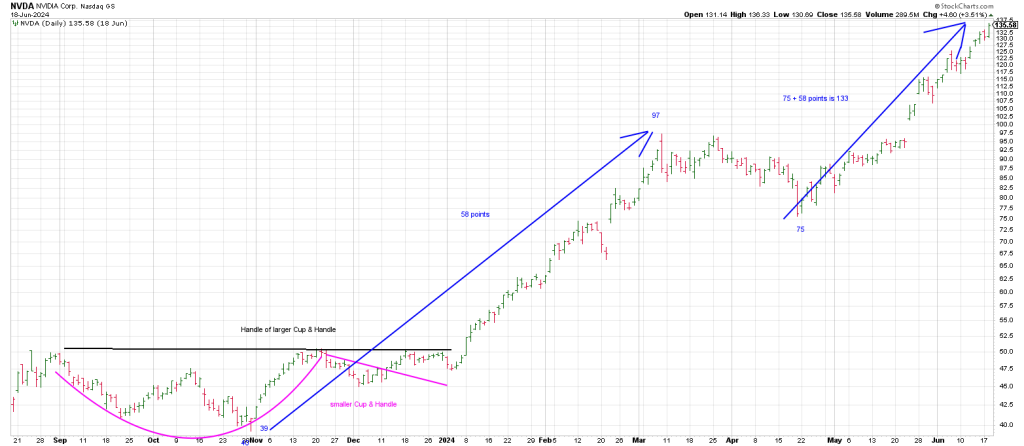
NVDA hit 136 on Tuesday, up from 75.60 on April 19th
Notice that NVDA came out of a Cup and Handle in January 2024,
The low of the Handle is 40.
40 squares out with 11. It is straight across and opposite, 540 degrees up from 11.
Interestingly, the square out in the 130 region is a Measured Move as well.
Allow me to explain.
The first leg up from the low of the Handle at 39 to March 97 high is 58 points.
Adding 58 points to the April 2024 low of 75 gives 133.
NVDA is in the Wheelhouse.
Drilling down to the SPX hourlies from April show a clear 5 wave advance has unfolded.
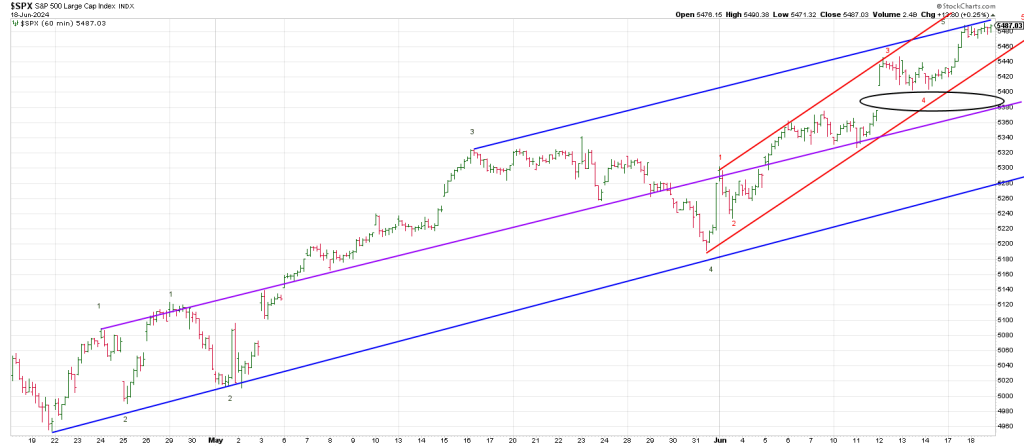
Clearly the SPX has exceeded by expectations in April/May as to how far it would carry.
That happens.
It happened in early 2020 when I called for a top in late January to be followed by a crash.
Instead the top was Feb 19th.
The SPX crashed 34% in 23 trading days.
It was the fastest quickest crash in history.
Many said I was crazy as markets “don’t crash right off highs”.
They are correct.
Even the 1929 crash did not happen right off the high like 2020.
Nor did the 1987 crash.
But I stuck to my guns that a crash would play out off a top in early 2020.
On the day of the low, March 23, 2020, we forecast a run to 4000 SPX within a year.
That’s nearly a 100% advance in a year.
The SPX eclipsed 4000 on April 1st, 2021.
I was off by a week.
It happened in 2007 when my forecast for a major top in mid-July saw a top and a sharp reversal into August but a new all-time high roughly 90 days/degrees later on October 11th.
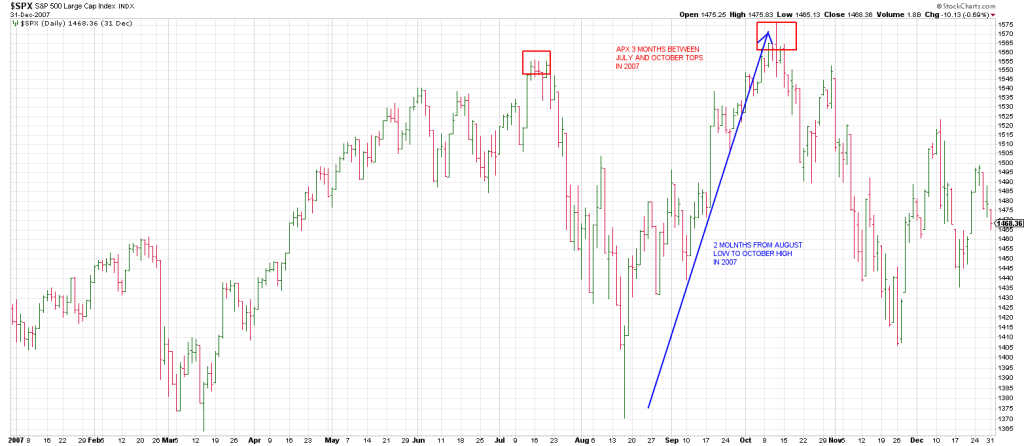
The 2007 analogue is interesting.
3 months after a Primary High on July 19th was a Secondary High on October 11.
Notably, the Secondary High was slightly higher than the July peak.
2 months after the shake-out low in August was the top in October.
Here in 2024, we may have a Primary high on March 21st.
3 months later is June 21st.
2 months after the April low will we see a record high?
I was early in 2011 when I thought early August marked a low.
An undercut of that low occurred two months later in early October.
Sometimes things line up perfectly.
Such was the case for my prediction of a top on March 24th, 2000.
Ditto my forecast for a Secondary High on August 31st, 2000.
Ditto my forecast for a nasty bear market to start in early January 2022.
I think there is a strong likelihood that the above tops will pale in significance as to what we are looking at currently.
That is because the structure shows multiples of 5 waves ending from as long ago as the July 8th, 1932 low.
Interestingly early July 2024 “points to” 95 on the Square of 9 Wheel.
95 years ago is 1929.
As well the breadth divergences, new high, new low divergences and A/D Line divergences which we’ve walked thru in this space over the past few weeks are some of the longest and largest in history.
For example on Friday, June 15th we got the largest SPY/NYMO (NY McClellan Oscillator) divergence in history.
What that means is the NYMO was the most negative at -49 attending a record high in the SPY/SPX than at any other time.
In sum, just as the April 19 low is roughly 180 degrees from the October 2023 low,
June 21st is 90 degrees from the initial high on March 21st.
This time period is a natural seasonal turning point (+ or -).
As well as offered above, June 24th mirrors the 16 day final leg up to September 3rd in 1929.
Additionally the 411 (4104) October low squares out with June 24th.
NVDA’s potential time price square-out synchronous with the SPX time/price square-out in this time frame may be a colossal canary in the Wheelhouse,

Square of 9 Wheel
Purchase your own Square of 9 Wheel. Shipping to US only. Contact Jeff for shipping outside the US.