“Things are going to slide, slide in all directions
Won’t be nothing
Nothing you can measure anymore.” The Future, Leonard Cohen
There were few new headlines out of the Middle East over the weekend, mainly because only Israel and Iran are capable of judging the damage.
They’re not saying much.
Wall Street on the other hand seems quite confident that whatever is happening, and irrespective of the outcome, it will be quite bullish for stocks.
As much was evident on Friday, when several momentum names bounced back from heavy losses early in the session and then spent the remainder of the day building a launching pad for Monday.
For example:
META
NET
EAT
And CRCL to mention a few.
Monday’s surge would be chalked up as just reckless behavior but we have become used to it as the stock market has increasingly decoupled from geopolitical and economic reality for many years.
Maybe it’s just the big boys ‘saving the baby’.
Maybe they think Howie Mandel will get the two parties to make a deal without a billion dollar Obama suitcase.
Is Wall Street to0 stupid to worry or did they get blindsided and needed a graceful exit?
It’s possible investors are simply hoping for a brighter tomorrow with Iran no longer able to export terror to the world.
Who is THE market shrink in chief anyway?
That’s why we turn to the technicals.
They have more to say than usual.
On Friday the SPX broke a 3 point trend line triggering a Rule of 4 Sell signal.
On Monday the index gapped up from support to backtest the trend line.
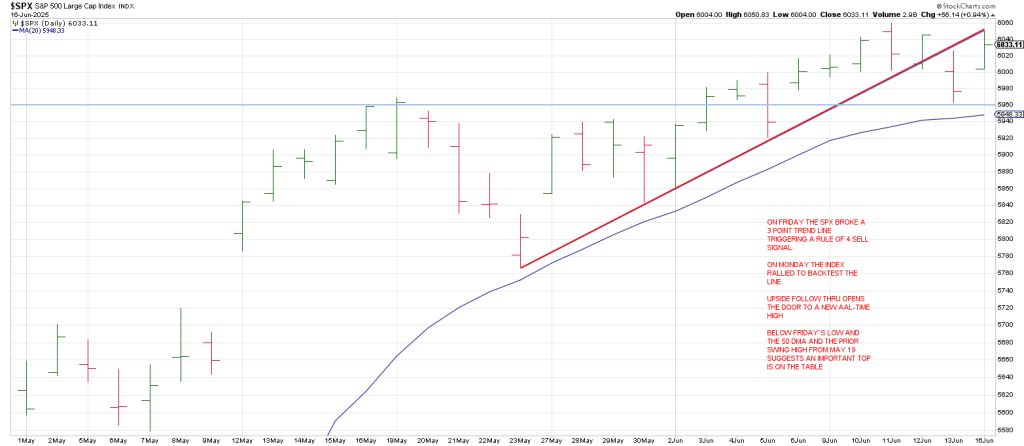
We’ve got an inflection point:
1) Upside follow thru opens the door to a new all time high
2) Below Friday’s low and the 50 day moving average and the prior swing high from May 19 suggests an important top is on the table
Checking a big picture weekly QQQ from the 2008 bear market low (QQQ bottomed in Nov 2008) shows a Tops Line from the November 2021 top and a Bottoms Line from the October 2022 low intersect in the next quarter.
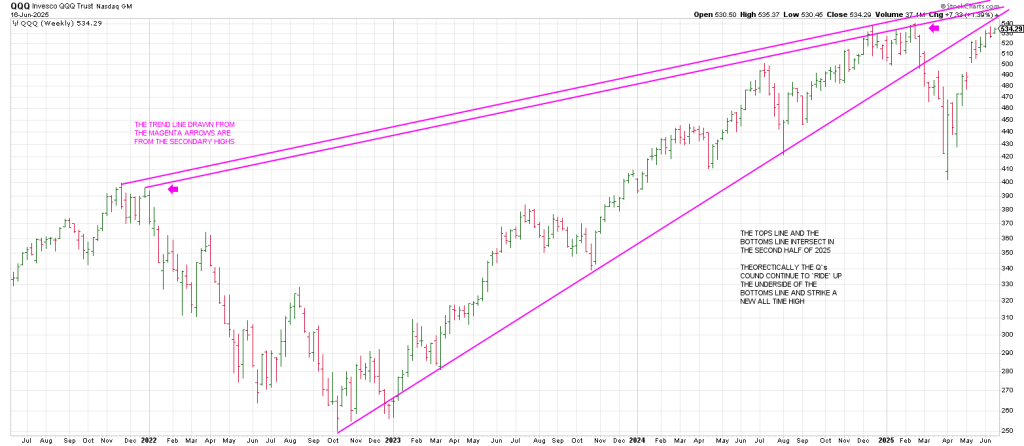
Theoretically the Q’s could continue to ‘ride’ up the underside of the Bottoms Line and strike a new all time high remaining in the spirit of a backtest.
The presumption is from my perspective we have come too close not to set an all-time new high.
From that point the likelihood is a meaningful correction.
For example if we get to the 6200 region then a pullback of 500 or so points to important support.
If that is correct it is the structure of such a pullback that will tell us if we’re going to have a final leg up.
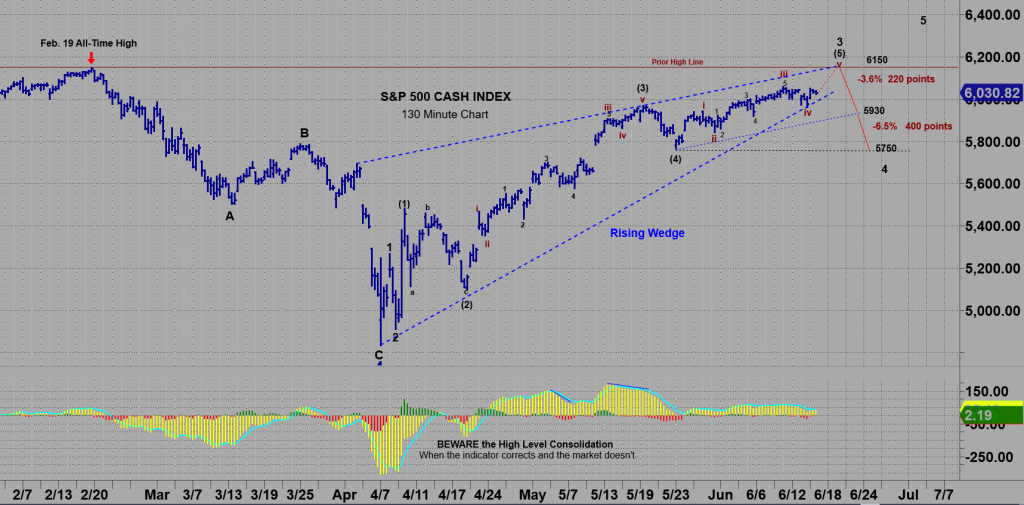
If the Elliott Wave count is correct a new high completes a Wave 3,
The -3.6% and -6.5% are subsequent shallow theoretical corrections levels for corrections.
If the scenario plays out I think we get an 8 to 10% correction that hold the 5750 region
Along with the SPX and the Q’s, GLD is at an inflection point.
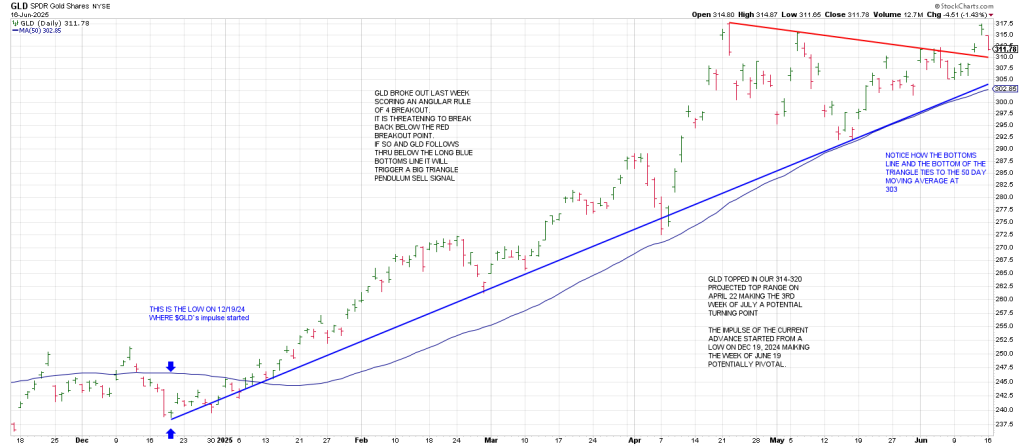
GLD broke out last week scoring an Angular Rule of 4 Breakout.
However it is threatening to break back below the red breakout point. If so and GLD follows thru below the long blue Bottoms Line it will trigger a Triangle Pendulum sell signal.
Notice how the Bottoms Line ties to the 50 day moving average at the 303 region.
In sum GLD topped in our 314-320 projected top range on April 22 making the third week of July a potential turning point (90 days/degrees later). It has either been in a high level consolidation or distribution.
The impulse of the current advance started from a low on December 19, 2024 making the week of June 19 (180 days/degrees later) potentially pivotal.
In sum, the next month looks like it is going to see some fireworks in gold.