“I’m a rollin’ thunder, pourin rain
I’m comin’ on like a hurricane.” Hell’s Bells, AC/DC
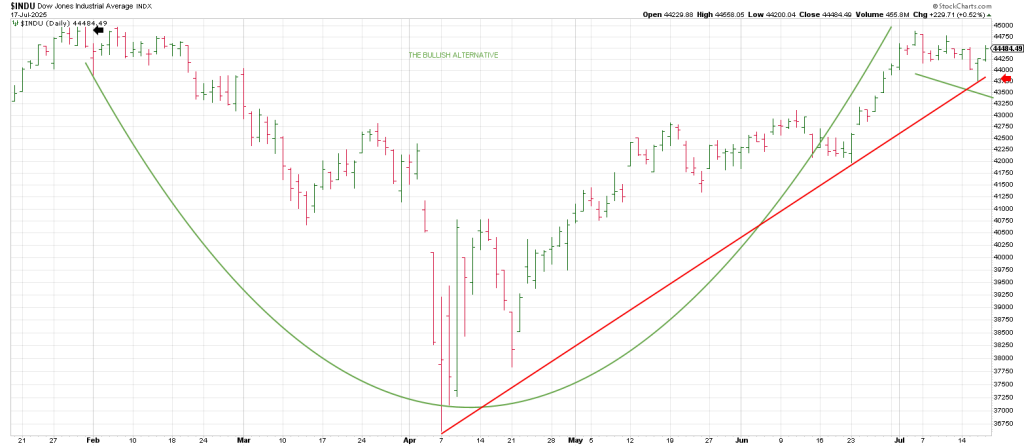
Today squares out with 63 (6320) on the Square of 9 Wheel.
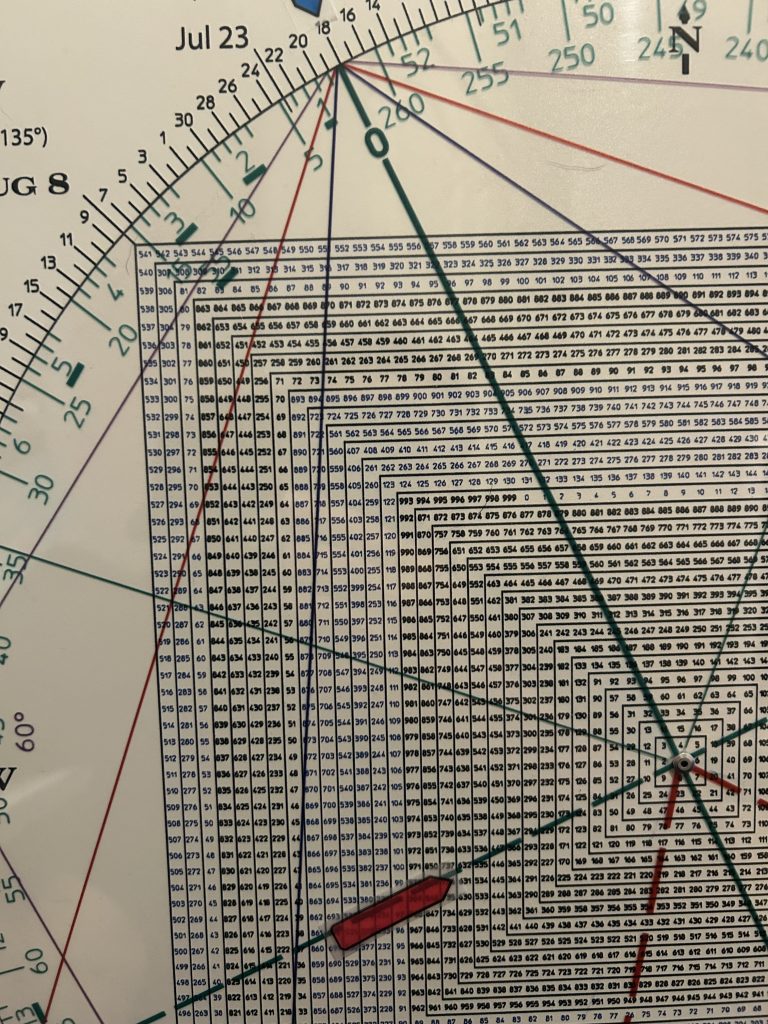
April 7, the low, squares-out (180 degrees straight across and opposite) with 634 (6340).
This is a pretty tight cluster of Time/Price synergy.
In my experience when markets run hard into a Time/Price square-out the odds it will be a turning point are very strong.
It’s like hitting a brick wall versus walking into a brick wall.
You get the picture.
July 19th is the anniversary of the Primary high in 2007.
This was the Primary High prior to the Great Financial Crisis.
The market experienced an air-pocket from July 19, 2007 into early August and then grinded back up into a nominal new high in mid-October, 90 degrees/days later, where the market started rolling over in earnest.
180 degrees/days from the July 19, 2007 high the wheels started coming off.
This is the 18 year anniversary of the Primary High in July 2007.
18 years is the North Node (Rahu) cycle.
We talked about the importance of a Rahu cycle as to crashes. here in July in a recent article.
The North Node is a major cycle. 18 years is considered the business cycle and the real estate cycle.
18 months is a cube (540 degrees), so 18 years is a fractal or Master Cube in time so to speak.
We know that WD Gann considered the moon a key to the market because in his coded novel he uses ‘69’ as a cypher.
69 is the symbol for Cancer that is ruled by the moon.
Last fall I thought there was a strong likelihood that a major top would be struck in January/February 2025.
It was.
The DJIA monthly below proves the cycle.
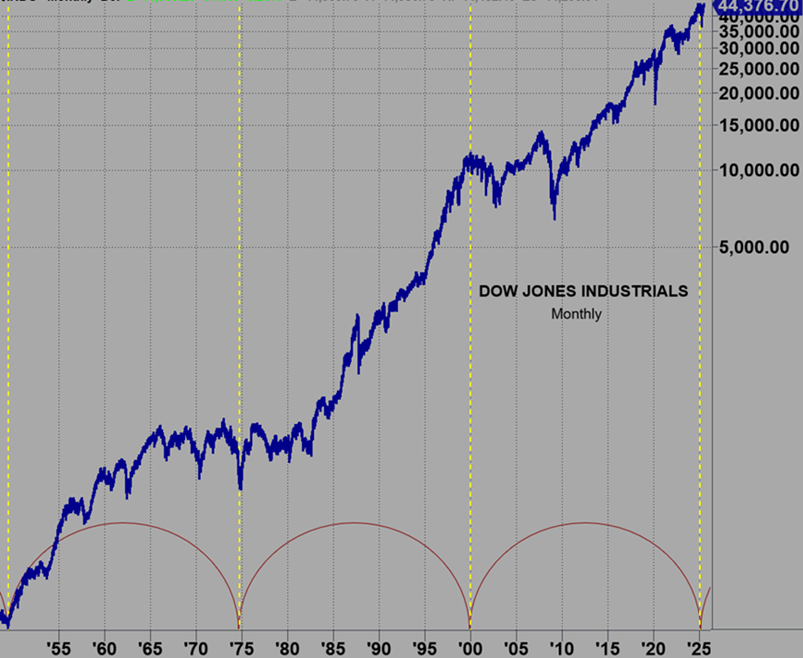
There is 303 months between each of the vertical yellow lines…basically 25 years.
What’s interesting about the 25 year cycle is that it is one-half the Jubilee Cycle, a Biblical Cycle of 50 years.
This cycle follows SEVEN sabbatical years, (seven cycles of seven years, totaling 49 years, with the 50th being the Juilee.
The first line ties to the start of a secular bull market in 1949.
25 years later is the low in late 1974.
25 years after the late 1974 bear market low ties to the DJIA top in January 2000.
Exactly 25 years later is early 2025.
The DJIA actually topped on December 4, 2024 at 45,073.
It has never exceeded that level.
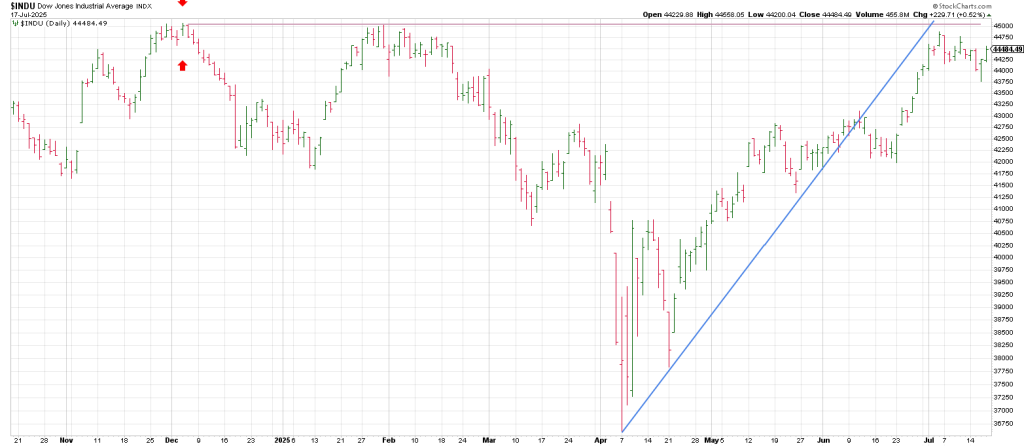
The DJIA carved out an outside down reversal day on January 31, 2025 which kicked off the waterfall decline into April 7.
7 months (panic) later is July 4, 2025.
The DJIA struck a high of 44, 885 on July 3, 2025.
You can’t make this stuff up.
So we have yet another divergence between the major indexes: The DJIA has not scored a new high in 7 months while the SPX and NDX have meaningfully bettered their highs from February.
The bottom line is while I thought early 2025 would mark a significant high, I did not think the market would recover from the spring crash this quickly to put in a Secondary High…if at all.
Yes the spring sell-off qualifies as a crash. The SPX lost 20% in TWO months.
When the deluge hit last spring it looked like the back of the market was broken—especially based on the DJIA monthly cycle in the above chart.
Why would anyone expect a new high in just 2 months off the April low?
Here’s how rarified (and might I add unsustainable) the “rebound” is.
After the 1929 crash it took the 25 years for the DJIA to see the pre-crash highs.
In November 1954 the DJIA finally cleared the 386 high struck in Sept 1929.
Interestingly the crash low in 1929 occurred in NOVEMBER as well.
I mention this because JULY was the Great Depression low in 1932.
I don’t know if this July is a Secondary High to the Feb high or whether we get the shake-out I’m expecting to start any day and then back up into October/November.
One might ask if cycles and time/price synchronicities are the key to markets then why can’t we know?
Why don’t I know more specifically.
It’s a fair question.
I will answer it this way: Bobby Fischer and Boris Spassky were chess giants.
Still, they had to read each move as the board unfolded.
Similarly, the market is dynamic and we have to read how Time and Price perform on this 3-D chessboard we call the market as they unfold.
Succinctly, the market is not a Rolex.
I knew the market would strike a high starting in January/February 2025, but I didn’t think a Secondary High would be a speculative orgy.
The rebound from the April 7 low was within the nature of a test of the February highs up until early June.
Then the SPX went sideways leaving two Topping Tail weeks. When it exploded through those ‘tails’ , a frenzy took over in many names which has reached euphoric proportions in July.
Names include:
RBLX, RKLB (both on our long radar the last two days), AVGO, AMD, TSM, HOOD, PLTR,EVR and of course ORCL and CRCL. To mention a few.
How insane is what’s going on?
Above I mentioned that it took 25 years for the DJIA to get back to is 1929 high.
After the 1987 crash it took 2 years to get back to the pre-crash high.
It took 6 years to eclipse the highs after the 2007-2008 crash.
It took 5 months to regain the high following the 2020 crash.
After the October 2022 bottom, it took 15 months to get back to the January 2022 peak.
It took TWO MONTHS for the SPX to eclipse the February 2025 peak.
The market is hyperventilating.
Why this is important is because markets walk before they run and run before they sprint.
Just as it sprinkles before it rains, and rains before it pours.
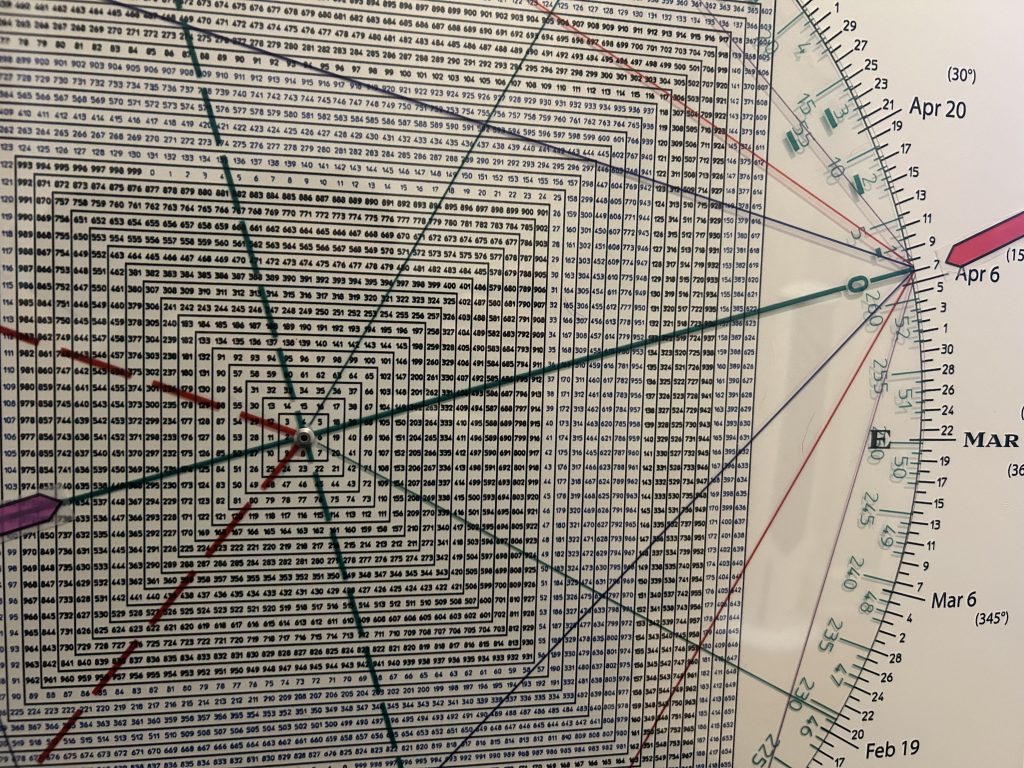
As offered above the market is sprinting into a two Time/Price square-outs on important anniversaries—
The 18th anniversary of the 2007 Primary high and the 93rd anniversary of the 1932 low.
Maybe something, maybe nothing, but this is potentially very interesting because on the Square of 9 Wheel 18 and 93 square-out. They are 90 degrees apart.
As well, July 1932 is the low of the Great Depression and July 2007 is the high prior to the Great Recession.
As I have been saying for a year my expectation is that we get some synergy between the 1929-1932 cycle and the current time frame.
For example just as the market tobogganed 3 years from 1929 to 1932, we have seen a vertical “crash up” from 2022 to 2025.
In sum, despite the narratives and the price action backstopping the “stories” the downturn will be epic.
And the top will be in 2025.