“The Direction Of Travel Is Clear” Powell August, 23rd, 2024
“The Problems In the Subprime Market Seem Likely To Be Contained.” March 28th, 2007
“The stock market is never obvious. It is designed to fool most people, most of the time.” Jesse Livermore
“ I was crowned with a spike right through my head.” Jumpin’ Jack Flash, The Rolling Stones
I can’t help but notice the dates of the above quotes by Chair Powell and Chair Bernanke.
Powell’s statement ties to the anniversaries of the 1929 and 1987 pre-crash tops.
Bernanke’s statement ties to the anniversary of the March 2000 top that marked a decline in the NAZ that mirrored the devastation of the DJIA from 1929 to 1932.
The markets job number one is to deceive. But it seems the Fed Heads are envious of Mr. Markets title as Deceiver In Chief.
Since the market speaks with forked tongue, the most important thing in listening to Mr. Market is to hear what isn’t being said.
This observation has proven true for as long as markets have existed and will continue to be true.
This is because as much as the mind of the market is math, the other side of the trading equation is the human mind pulsating with emotion.
The result is double helix of art and science
That said, very few weeks in the annals of stock market history has deception become so palpable as August 2024 when a Flash Crash turned into Jumpin’ Jack Flash.
After cracking 2024’s Bottoms Line on August 5th the SPX rocketed to the highs after recapturing this Line of Least Resistance.
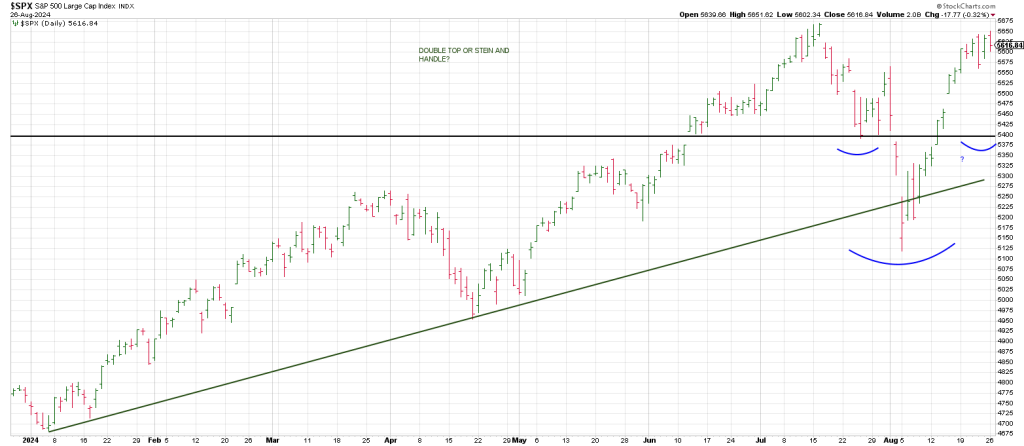
Now Mr. Market’s number one job is to deceive the most players: is the index tracing out a Double Top or a bullish Stein & Handle.
In keeping with my trading maxim that following flush-outs, a V Bottom is likely playing out when 50% of the drop is recapture, the same can be said about reversing back below this 50% ‘fulcrum”.
To recap the mid-point of the decline from the July 16 all-time highs of 5669.65 to the 5119.26 August 5th low is 5394.45.
Interestingly, notice how that ties to July 25th low. That is the shelf of lows on the initial decline off the top.
A drop back to this 5394 region theoretically could carve out a bullish inverse Head & Shoulders.
Of course, if this price action should play out, the Inverse H&S isn’t in play until and unless the Neck Line is triggered. If a decline plays out from current levels to the 5394 region then the Neck Line will be the 5650 region.
Alternatively, IF we drop to the 5394 region and it does not act as support, it means a bearish Blade Runner pattern is playing out. In other words a failure of the presumed inverse Right Shoulder.
As we know fast moves come from failed patterns. A failure below the 5394 area goes fa long way to validating the idea of a double top.
A Blade Runner sell signal going into the edge of the Gann Panic Window (this week into September 9th or so) suggest a third episode of volatility.
The third time is likely to be a charm for the Bear.
The stock market erupted into a buying frenzy in response to Fed Chair Powell on Friday.
“The direction of travel is clear.”
Many traders were thrilled, with may proclaiming that Powell’s announcement and the market’s reaction had sparked the beginning of a new Bull Market or at least signaled the continuation of the previous one for months or years to come.
But Livermore’s admonition that the market’s Job One is to deceive should tell us to take a step back and view the jubilation with a jaundiced eye and in a broader context—not merely through the lens of a single policy statement.
Many will recall a similar point in The Cycle back in 2007 when Fed Chair Ben Bernanke assure Congress and the investing public that fears of contagion from defaulting mortgages were unfounded. He acknowledged that while the economy might stall that year due to these pressures, it could still be expected to continue its upward trajectory in 2008.
HE INDICATED THAT THE FED WOULD SOON INITIATE RATE CUTS TO INSURE THE ECONOMY’S HEALTH.
Bernanke’s statements echo what we all heard from Powell on Friday.
In sum, following one of the most robust breadth sessions in years on Friday, net declines prevailed by the end of the day Monday.
SPX breakage below the 5600 region near Monday’s lows with follow thru that triggers a Jump the Creek sell below Friday’s ‘robust’ upside gap, opens the down door.
NVDA
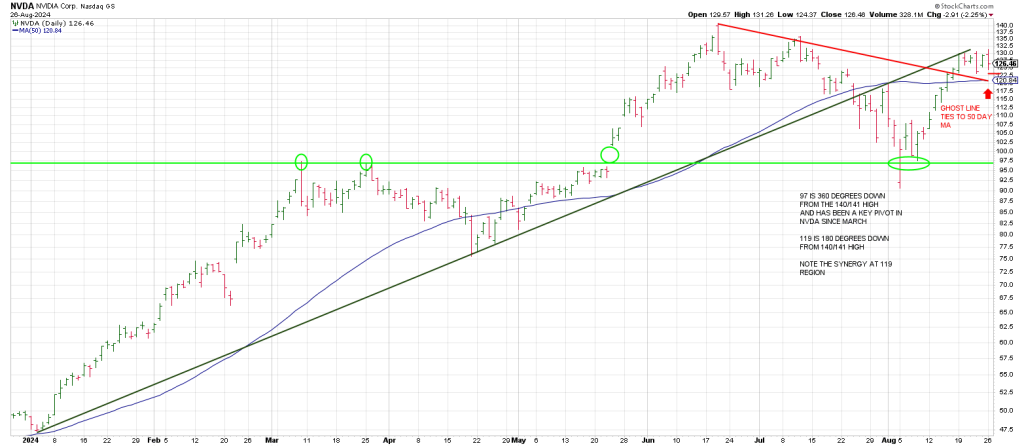
97 is 360 degrees down from the 140/141 high and has been a key pivot in NVDA since March.
119 is 180 degrees down
Notice the synergy at 119 region.
Breakage below the red Ghost Line and the 50 day line opens the door to 97.
SLV
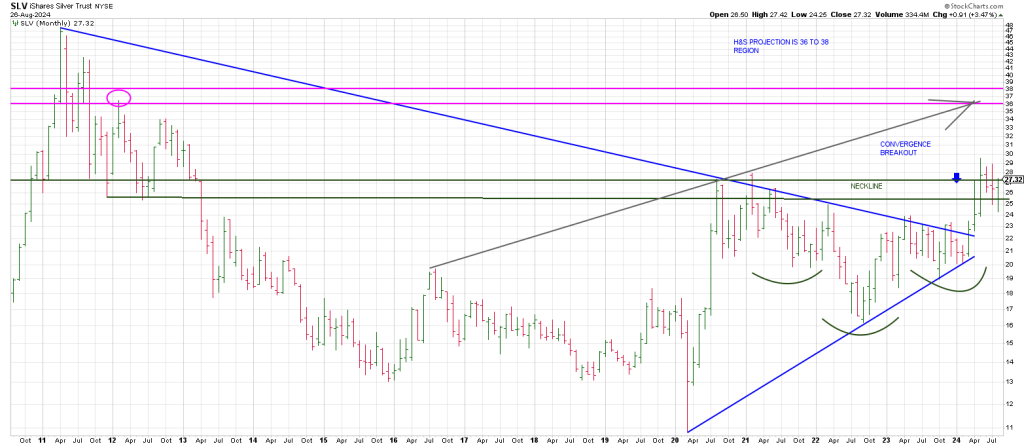
Above is a monthly SLV. An inverse Head & Shoulders projects to 36 to 38.
Notice SLV is in the monthly +1/ – 2 buy position.
The two combined look very bullish.
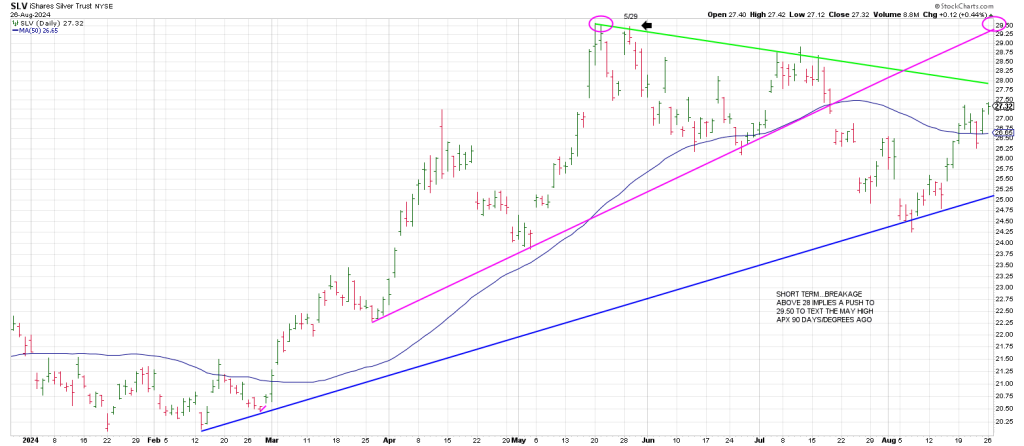
A weekly SLV shows it is poised to pop.
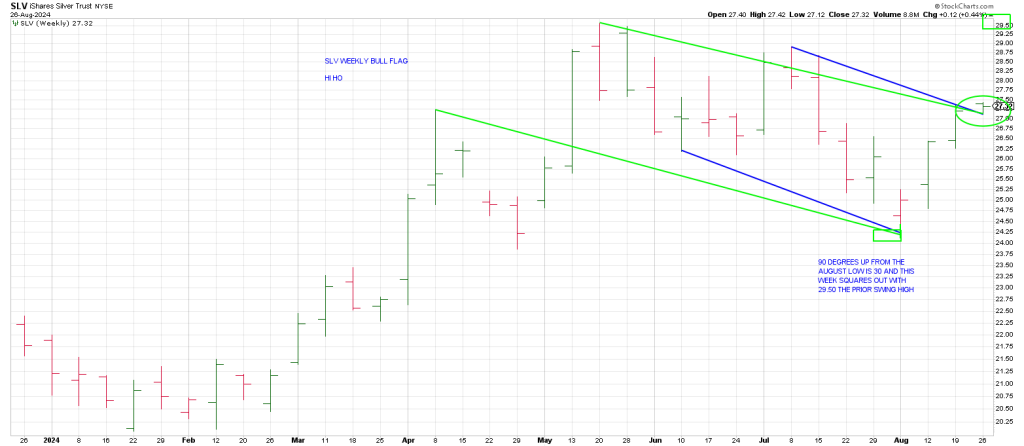
Drilling down to the SLV dailies shows a breakout over 28 should see price magnetized to the May swing highs at 29.50.
Late May was 90 degrees/days ago so it would not be surprising to see SLV surge this week.