“Big wheel keep on turnin’” Proud Mary, John Fogerty
The biggest stock in the world should ring a bell at the biggest top in the world.
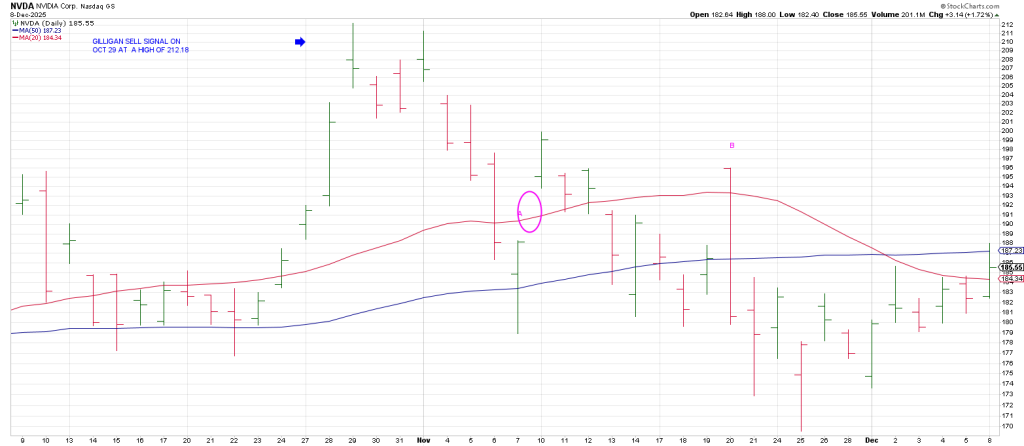
NVDA topped at 212 on October 29.
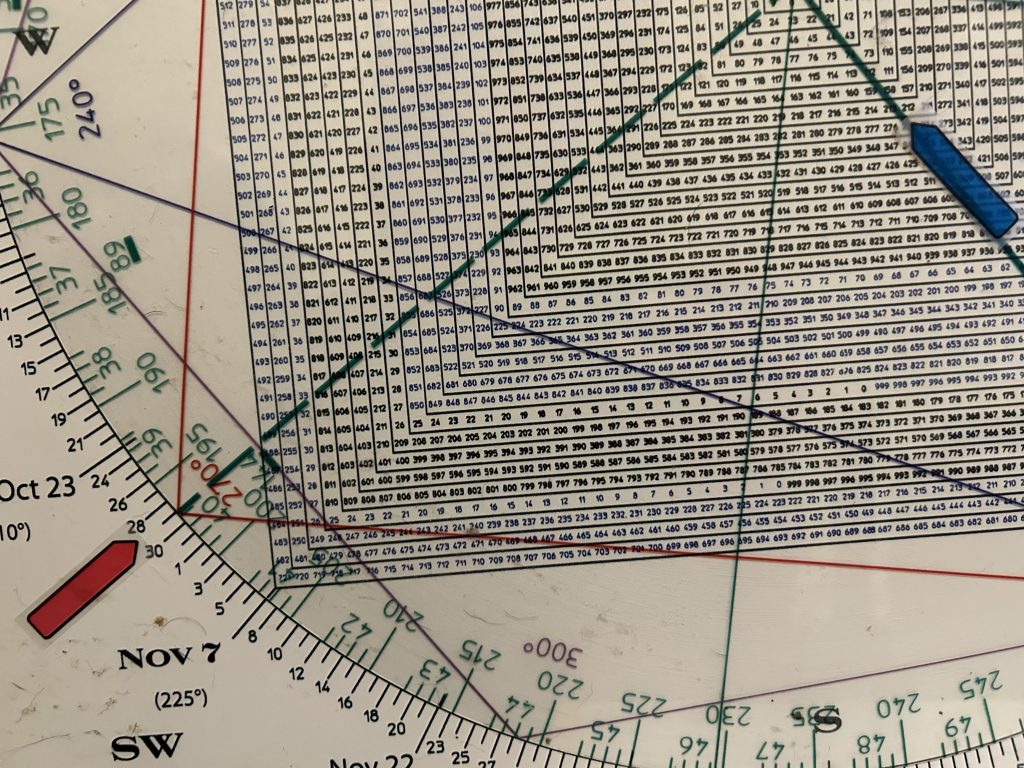
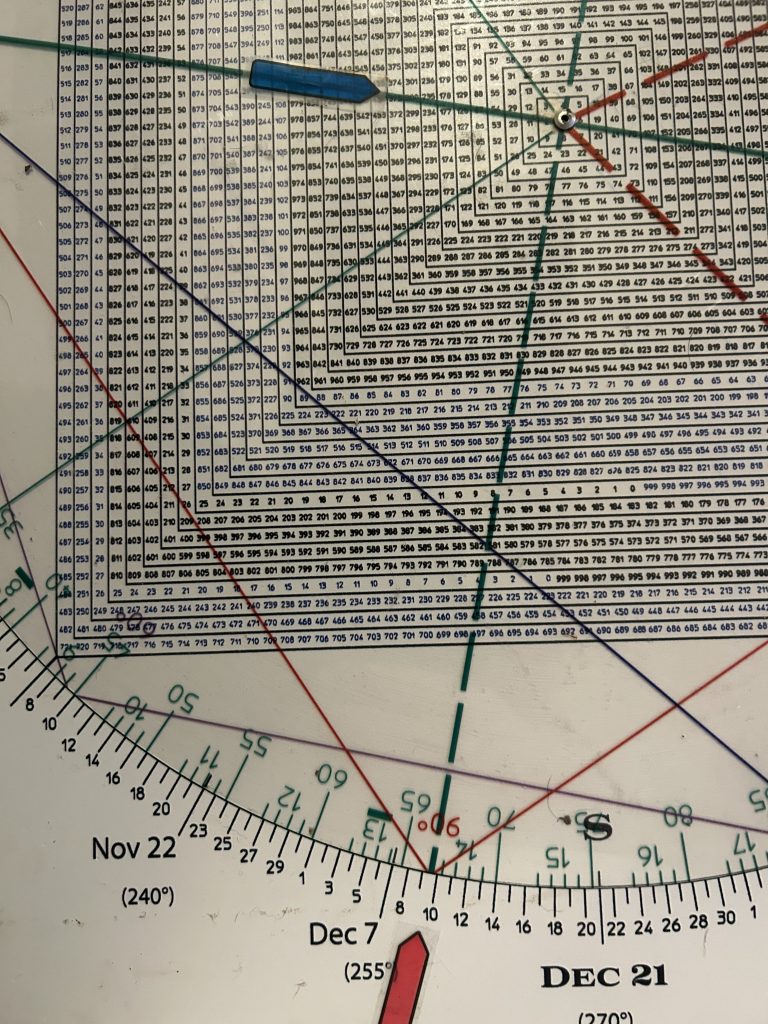
This was a Time/Price square-out as 212 squares Oct 29 on the Square of 9 Time & Price Calculator or Gann Wheel.
Is it just happenstance that NVDA and the SPX top, so far, was October 29, the Big Kahuna in 1929?
On October 29, NVDA left a signal reversal bar, a Gilligan sell signal.
This is a gap to a new 60 day high with a close at/near session lows.
90 degrees down from 212 is 199.
180 degrees down is 185.
270 degrees down is 171
NVDA knifed through the first geometric support, 90 degrees down, at 199 like a hot knife through butter as it turned its 3 Day Chart down on November 6 plunging to 179 the next session, undercutting its 50 DMA in the process.
From its all-time high NVDA had plunged more than 180 degrees in just SEVEN Gann panic days.
Bulls jumped all over NVDA on the undercut of the 50 DMA in league with a test of swing lows perpetuating a large gap to the topside the next session, November 10 .
From the Nov 7 low of 179, NVDA drove to 200 in two sessions.
The 21 point two day rip looks like a last hurrah.
Bulls also FOMO’d NVDA when it reported on November 19.
NVDA exploded 10 points the next morning—opening on its high for the day at 196, before diving to close on session lows at 180/181.
How many “last hurrah’s” and one-day wonders does NVDA get before it looks like the Emperor has no clothes?
Pulling back the lens we see that NVDA’s ATH was a Throw-Over of a 3 month channel…confirmed
When NVDA crashed back through the channel.
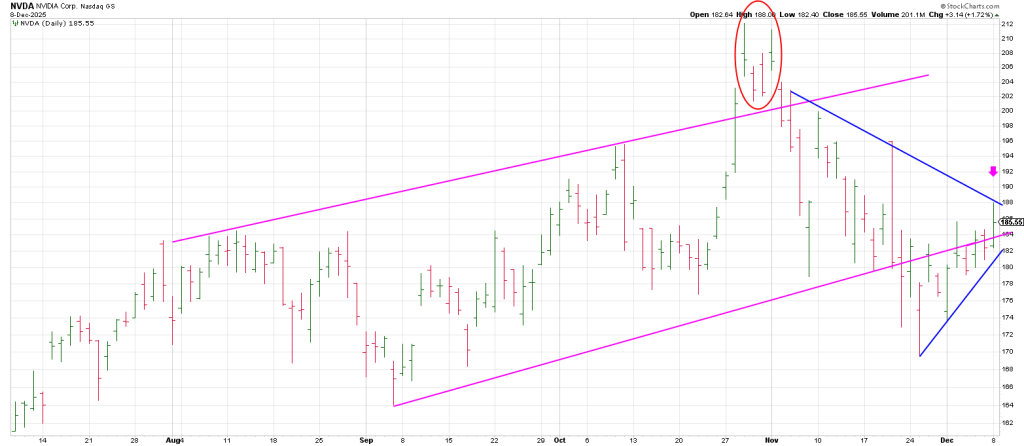
Monday NVDA rallied to 188 backtesting the lower rail of the trend channel before tailing off to close at 185.
In after-hours trading it rallied due to reports that the U.S. government would allow the company to export its H200 AI chips to approved customers in China.
it popped to 190—above its 50 DMA at 187.
In sum, NVDA turned its 3 Day Chart back up on Monday for the first time since its all time high…and in an attempt to recapture its 50 DMA.
It’s make or break time.
When the trend is down and the 3 Day Chart turns up, the normal expectation is that it defines a high soon, in terms of time and price.
As offered above, 270 degrees down from high is 171. NVDA’s low for the move off its all-time high was 169.55…essentially 270 degrees down.
A 90 degree rally off the low (which equates to 180 degrees down from high) is 185—right where NVDA closed on Monday.
So it’s going to be important to see whether NVDA can get traction or it gets magnetized back to this 185 region.
Breakage back below 185 opens the door to a test of 170.
Breakage below 170 opens the door to a full 360 degree decline off the all-time high to 158.
The 200 day moving average is at 155 and hasn’t been tested since it was reclaimed in May.
It’s overdue.
An hourly NVDA shows it pushed out of a triangle on Monday and is flirting with micro resistance (turquoise).
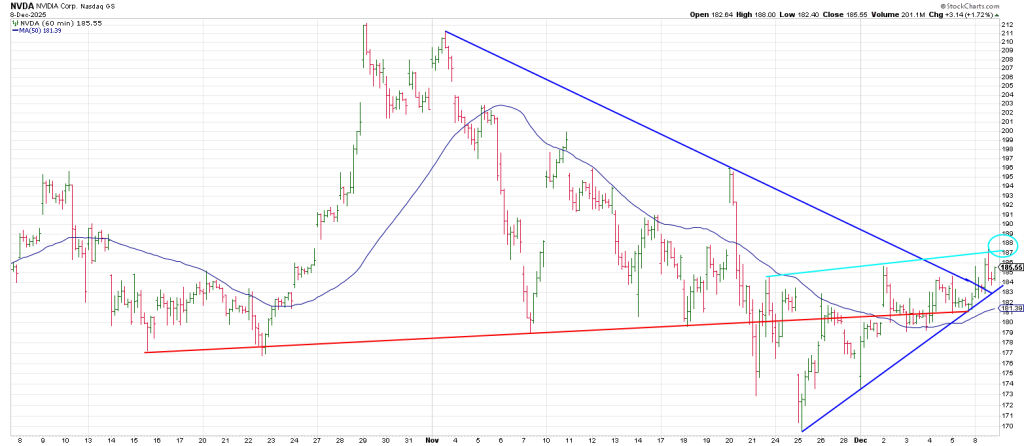
If NVDA reverses back below the blue triangle it will trigger a Triangle Pendulum sell signal.
This ties to the horizontal red Neck Line.
A Triangle Pendulum sell signal occurs when an item breaks out of a triangle one way then quickly reverses back through the other side of the triangle producing a directional move.
NVDA reclaimed its Neckline but a failure back below it projects to 150—with the 200 DMA exerting its pull.
The presumption is the angle of attack to the downside off the all time high implies a full 360 degree decline and a test of the 200 day.
When should that occur?
90 days/degrees from the October 29 high is late January with the 212 high “direct” January 30.
On a weekly NVDA I connected the June 2024 high and the November 2024 high.
The Ghost Line points to this 188 region.
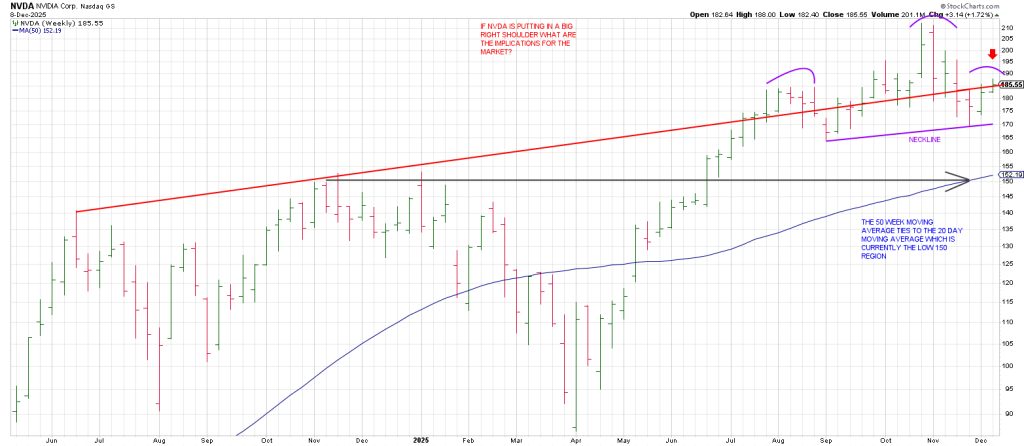
Notice that the 153 November 2024 high ties to 200 DMA currently.
Even in a bullish structure the idea of a pullback to “prior resistance becoming new support” would be logical.
Chips lead and NVDA is the Chip General.
On Monday SMH, the Semiconductor ETF closed 6 cents shy of its October 29 all-time closing high of 368.61.
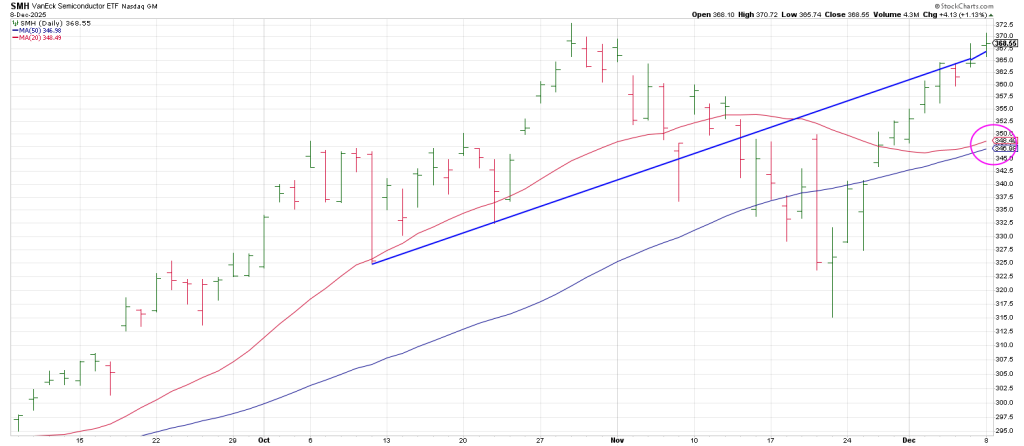
Is SMH making a Secondary High?
Importantly SMH snapped initial support (blue) in mid-November.
I call these trend lines from the past that extend into the future but that seemingly carry no relevance
Ghost Lines: Mr. Market has a long memory. He knows where the bodies are buried.
SMH has been hitting its head on this Ghost Line for the last week.
Monday it closed fractionally above it.
A reversal back below the Ghost Line suggests a quick drop to the 345-347 region.
On Oct 29 SMH scored a high of 372.78
On the Square of 9 Wheel 372.78 squares-out with December 9/10.
The implication is a Secondary High/double top is on the table
Breakage below the 20/50 day moving average Bowtie support at 345/347 opens the down door.
If the semi’s can’t get upside traction today, it may be another bearish instance of chip news getting sold.
In sum, most traders key off price. The old saw is “price is the final arbiter”.
But price can lie.
As the legendary W.D. Gann stated, Time is more important than Price.
Time tells trend. When time is up the trend turns.
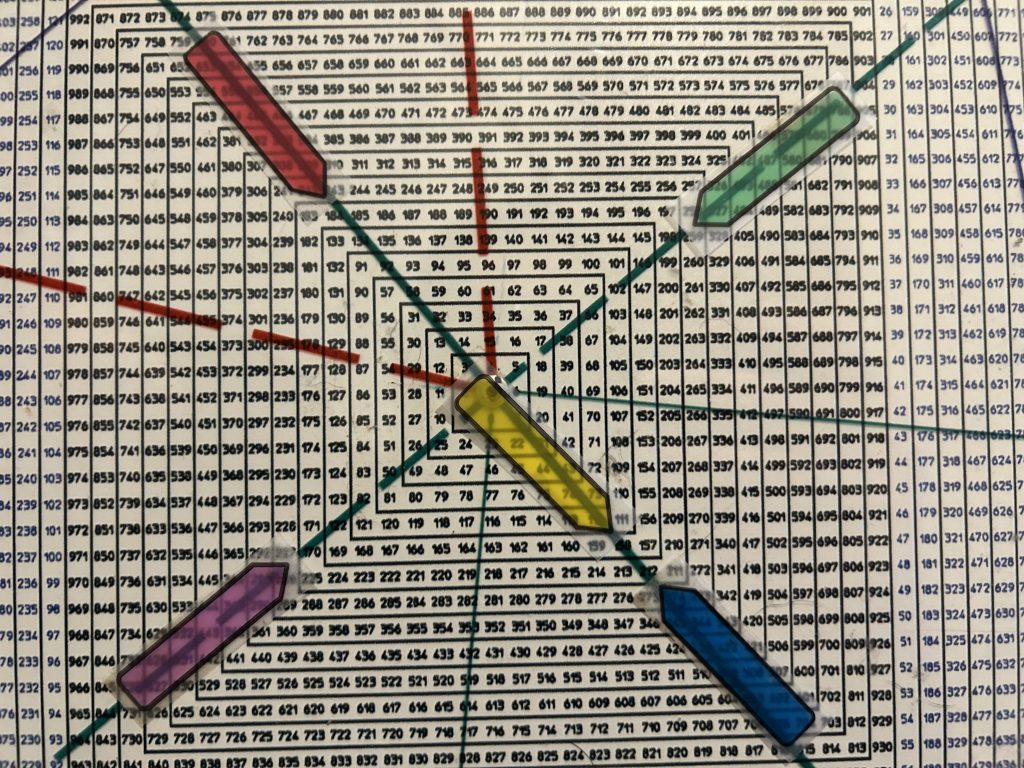
The Square of 9 Wheel is a unique trading tool that integrates Time and Price allowing us to measure the market.
At the end of the day, if you can’t measure risk, you can’t manage risk.

Square of 9 Wheel
Purchase your own Square of 9 Wheel. Shipping to US only. Contact Jeff for shipping outside the US.