“Deacons steal
And Ma can’t feel
If you’re lonely
And behind the wheel
When the ground gives way
You have to pray to the unknown
And hope it’s real.” Like A Diamond, Tom Petty
- The markets got very oversold…but crashes come from lows, not highs.
- The market rallied and is on its way to new all-time highs.
- We’re ready to see the market reverse and test its low.
- The market had its 10% correction and that’s all it really needed. Buy the dip.
- The market is going to break recent lows on the way to much lower prices in this Papa Bear.
- The markets haven’t really seen capitulation.
- Minor corrections in bull markets don’t really need capitulation.
- But 10% corrections should have capitulation.
There is only one constant in the market: everyone has an opinion.
There are always bulls and bears regardless of what is happening.
It’s enough to drive a trader crazy.
The market has generated all this discussion since its all -time high just 23 trading days ago.
It was just 16 trading days from its all-time high to achieve a 10% correction.
The art of being wise in the markets is an art. That art is knowing what to ignore.
It’s not easy.
We want to be open-minded, but not a sieve.
Yesterday, we walked through the significance of the 3 Week Chart.
Monday’s rally put an exclamation point on that significance.
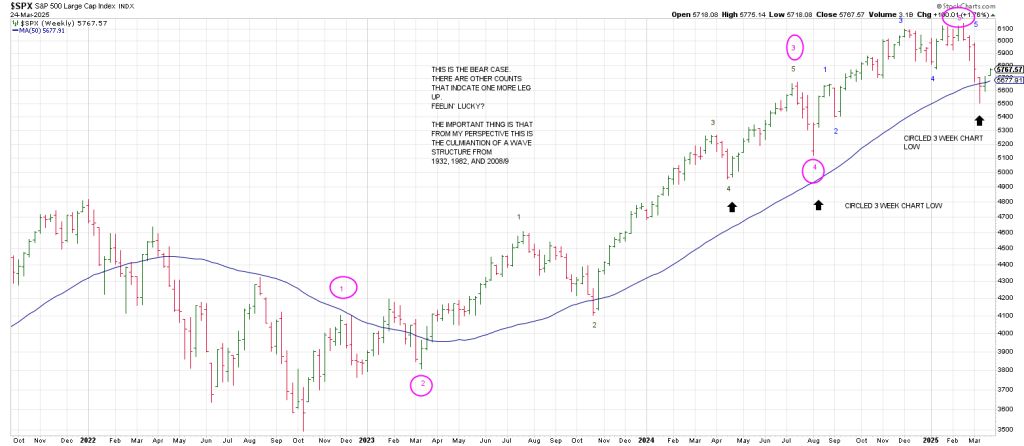
Below is a weekly SPX again, this time with my Elliott Wave count.
I am not a practicing Elliottician. I am more of an agnostic.
Primarily because I find that if you put 10 Elliotticians in a room you get 11 counts and that doesn’t include the alternate counts.
There are other interpretations to the advance since October 2022.
From my perspective a 5th wave has culminated.
If I am wrong a new leg up will unfold to new highs.
That will be all there is.
Feelin’ lucky?
Either we have completed a Super Cycle structure from the lows of 1932, 1982 and 2008-9 or we have one more last ditch rally.
My cycle work suggests that we’ve already struck that top.
of course I could be wrong.
We are going to know sooner rather than later.
I am not going to go through a litany of cycles in this piece.
I will continue to point out more cycles throughout the week.
That said let’s turn back the clock to the Great American Eclipse from August 21, 2017.
Long time readers will remember our discussion of that at the time and how it would
Exert its influence in the future.
The February 2025 all-time high is 7 ½ years from the August 2017 historic eclipse.
7 ½ years is an important periodicity. It is 90 months.
As Gann explained, markets work out in 90 degree, geometric increments in days, weeks, months and years.
Markets also operate within a framework of 90 degree squares in price.
Speaking of eclipses. We have a Solar Eclipse on March 29. On the same day we have a 6 planet convergence mirroring the Harmonic Convergence near the August 1987 pre-crash top.
Is it possible we rally hold up until the end of the week?
Yes, the 3 Day Chart has not turned up yet.
That said we are in the Weekly Minus One/Plus Two sell position.l
Using the actual high of February 19th, a fresh Gann Panic Window opens around April 8th and culminates around April 15.
Interestingly, this solar eclipse and the planetary alignment tie closely to April 2, Tariff Day.
How will we know if we’re going to march to a new high?
First, as you know my Rule of the Road #1 is that after a washout, recapturing 50% of the drop puts the market in a position to go to old highs…and more.
That number is 5826.
Yesterday we noted that 360 degrees up from the 5505 low is 5805.
Got Geometry?
581 (5810) near the 50% retrace) and 360 degrees up from low squares out with January 24, the all-time high
You can’t make this stuff up.
In sum, in order to answer whether the bull market is over, we key off the 3 Week Chart.
From the above weekly SPX:
When the 3 Week Chart turned down in August it defined a low.
When it turned down in April 2024 it defined a low.
When it turned down in August 2023, it did NOT define a low.
However, that did not occur from an all-time new high. As well it did not follow a blow-off.
That said, when the turndown in August 2023 failed to define a low, it opened the door to lower prices.
This March turn down of the SPX 3 Week Chart occurred in tandem with an undercut of the 50 week moving average (which ties to the 200 day moving average).
This is the ‘circled’ 3 Week Chart low.
Violating that low, 5504.65, by even one tick will trigger a Time Turn Trend sell signal.
We can see what happened in 2023.
Again the difference being that potentially a major top can be counted.
The T Rex in the ointment is that our recent low of March 13 was a square-out of the 6147 all-time high.
This is because 615 (6147) squares out with March 13.
You can’t make this stuff up.
The takeaway is this: the Time/Price square-out on March 13 has perpetuated a strong rally.
The other side of the coin is that a failure below this square-out is a Get Out Of Dodge sell signal…
Because not only is the square-out breaking down, but a Time Turn Trend sell signal will be triggered as well on breakage below the 3 Week Chart low.