“Credulity is always greatest in times of calamity.” Charles MacKay, Extraordinary Popular Delusions and the Madness of Crowds
Headlines yesterday blared Japan’s Nikkei sees biggest rout since 1987s Black Monday.
The Nikkei plunged a stunning 12.4% as the yen rallied to a 7 month high versus the U.S. dollar.
It was the index’s worst day in percentage terms since October 1987…37 years ago.
Hit and Run members were ready to capitalize on the Shock Wave having bought August 23rd 525 SPY puts last week at 2.85.
We sold them on Monday’s open at 21.34.
As well members went long UVXY last week at 26.25 exiting the balance at 62.50 on Monday morning.
We were looking for waterfall decline and a Black Monday as showcased throughout last week.
Most of those reports we made available on public Twitter/X due to the significance of the impending price action.
In additions to the many factors aligning for a deluge, August 5th squares out with 37.
1987 being 37 years ago.
Last week we posted:
THIS
THING’S
GONNA
CRASH
Monday Monday was all we hoped it to be: we sold them on open at 21.35.
Why did we lock in the gain? It could have been a crash like 1987 or 1929 and been down a lot more?
Two reasons:
- Too early in the cycle.
- As we posted on the Hit and Run Private Twitter Feed, 508 (SPY) is 180 degrees straight across and opposite August 5th for a potential Time/Price square-out.
A half hour before Monday’s open the SPY struck 508.
It never went lower.
In regular trading hours it opened at 511.64, closing at 517.38.
As I write, Monday night the futes are up 66 handles translating to a SPY of approximately 525.
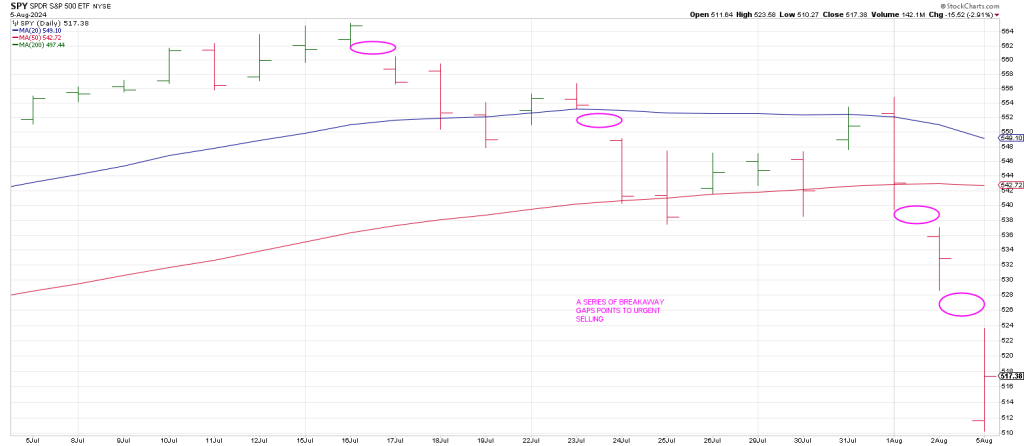
The overhead 20 hour moving average looms in tandem with Phil D Gap.
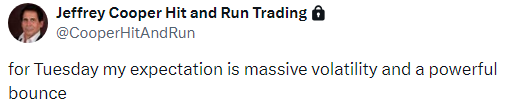
A Turnaround Tuesday is in keeping with our tweet to members an hour and a half before Monday’s close.
The VIX (Volatility Index) surged to an intraday high of 65.73, the highest extreme since the Covid Crash in March 2020 when the VIX exploded to 85.74 intraday.
The all-time record high VIX is 89.53 on October 24th, 2008.
That’s an interesting anniversary— it was the first of 3 crash days in October 1929.
I know the vast majority of market participants think anniversary dates (as W.D. Gann indicated) are important lynch-pins, but the mid-July cycle tops in 1990, 2007 and 1998 all converged to exert their downside influence this year telegraphing to us a slide was on deck.
This year the SPX topped on July 16th. The SPX closed virtually on session highs that day.
There was “no sign” of trouble ahead if you just consider Price.
But Time was blaring a sell siren.
And Time was lining up with my San Andreas Indicator.
I walked through the essence of this indicator in mid-June, 2024. See below.
We have a fleet of Hindenburg Omen potential crash signals on the clock projecting a crash in the next several months.
We also have a series of Titanic Syndrome warnings. This occurs when the market has reach a new high over the past 7 sessions with more stocks hitting new 52 week lows.
Like the Hindenburg Omen it confirms that under the surface of an index, individual stocks have been peaking.
The tip of the speculative sword is the NAZ where the “growth story” stocks reside.
Despite the NAZ running hot this month (June), most days have seen more stocks at 52 week lows than highs. This has been the case in 9 out of 10 days.
There has been only one other instance in the last 40 years: late October thru early November 2007.
If your wee trading at that time and heard about the disparity and the market just “hung in there” you probably would have said “indicator schmindicator”.
Indeed nothing really bad happened following the Primary Top in July 2007 and the Secondary Top on October 11, 2007 until January 2nd, 2008 when the bear entered in earnest.
In sum, my San Andreas Indicator combines historically rich valuations, unfavorable internals, long tern cycle analysis. Most important it integrates Time/Price synchronicity.
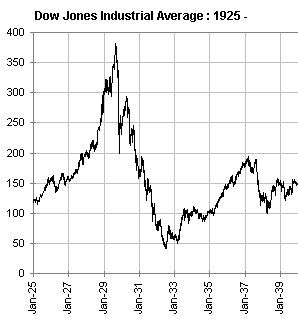
For example, 1929 was 95 years ago.
The DJIA high in 1929 was 386.
95 and 386 “vibrate” with July in keeping with Gann’s Law of Vibration.
Mr. Market’s M.O. is to lull players into a deep state of complacency.
The indicators came. The indicators went.
They didn’t matter until they mattered. As usual.
Most market participants were transfixed by the transactional tape.
It takes time for markets to turn, like a tanker, slowly, then all at once.
The moral of the story: crashes don’t come from too much bullishness. They come from too much complacency.
Despite Monday’s Air Pocketism, I saw no real sense of panic on the Street or on MSM.
Sure stocks gapped down big, but the buy the dippers were out in droves.
Monday was seen as an opportunity.
My expectation is that Mr. Market will disabuse the buy the dippers of that mantra sooner than later.
Let’s look at a few examples.
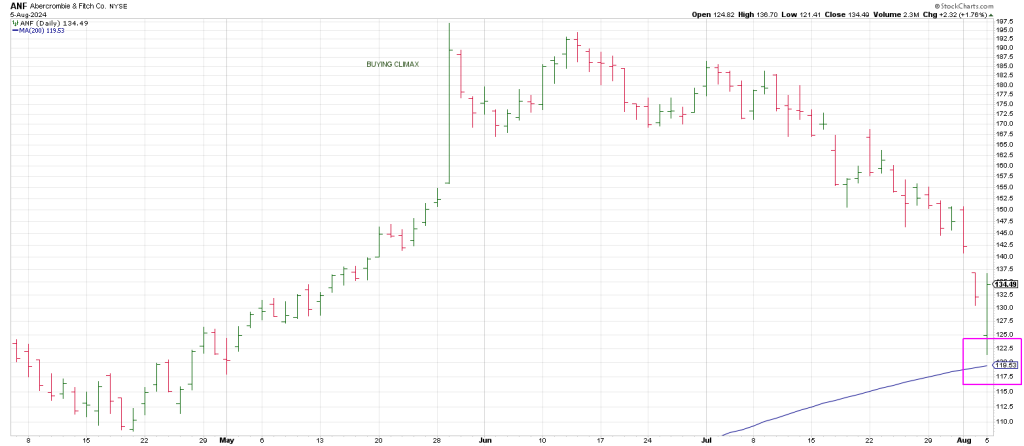
ANF opened gaped down, skidded to its 200 day and reversed with authority leaving a Hit and Run Gilligan buy signal. This is a gap down to a new 60 day low with a close at/near session highs.
Not all setups are created equal.
Follow thru is key.
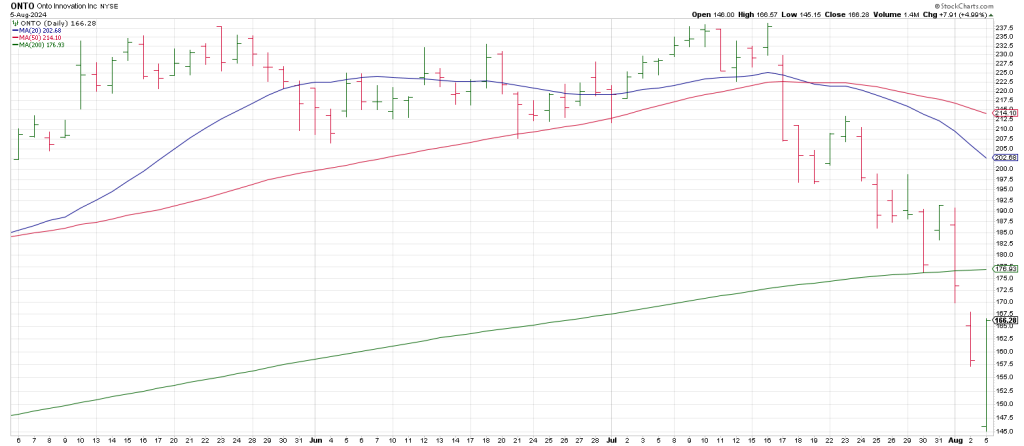
ONTO gapped down 12 and reversed sharply also leaving a large range Gilligan buy signal.
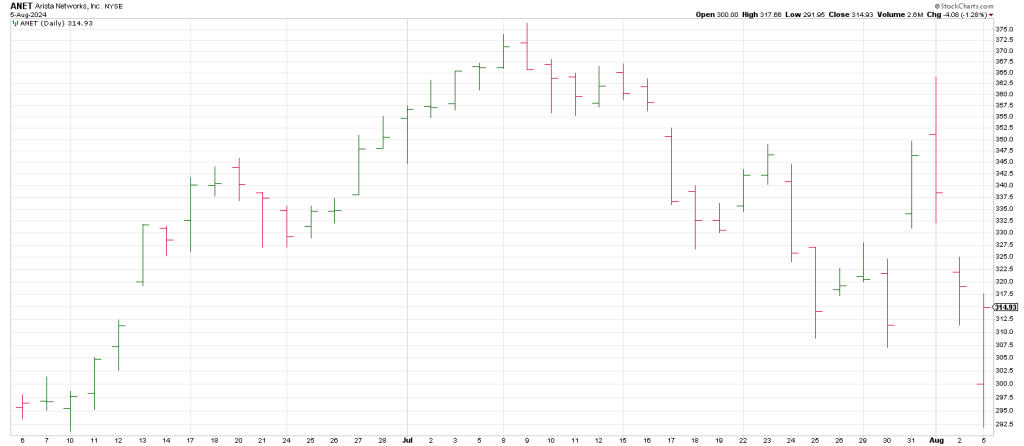
We flagged ANET as a buy on the open as it tested June lows.
It struck a low shortly after the open and ripped higher.
Hit and Run members traded it 3 times for winners carrying the last trade overnight.
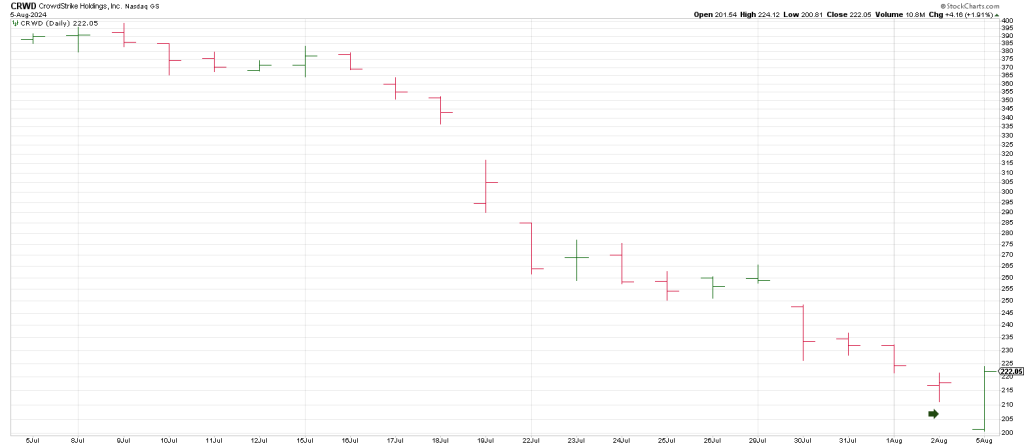
CRWD left a Combo buy setup Gilligan and a Key Reversal Day.
Hit and Run took a long swing in CRWD near the close at 222.
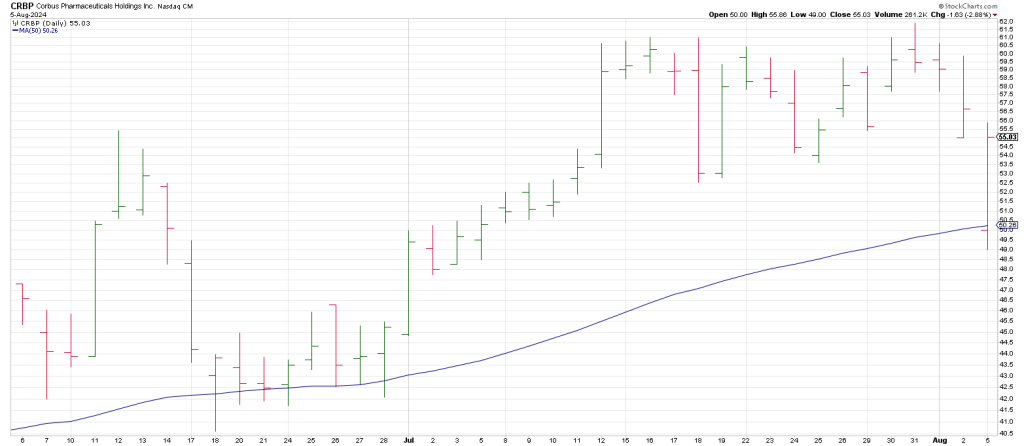
Early Monday Hit and Run took one our favorite biotechs CRBP long as it tested its 50 day line.
In sum QQQ reversed off the open from a Undercut of its 200 day moving average.
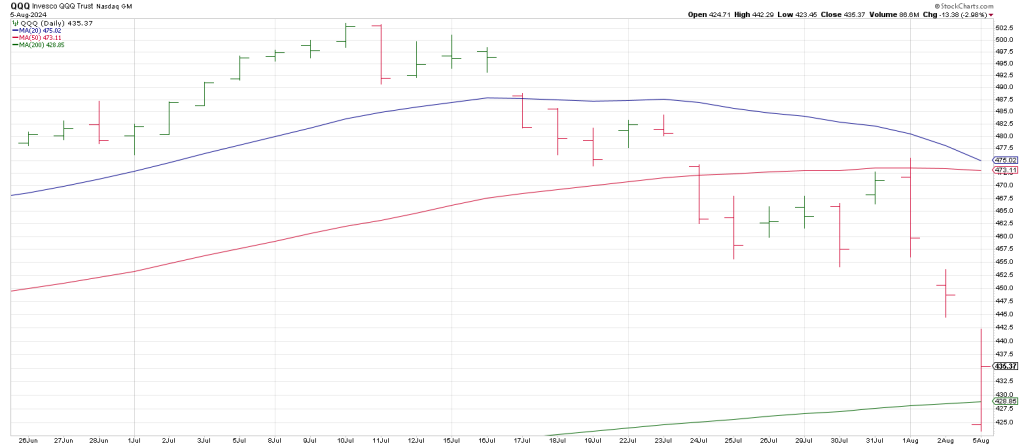
The Q’s got very close to our idealized 418 square-out level flagged last week.
418 is 360 degrees down from the 503.50 July 10th record high.
The rebound is not surprising, the first time down to the 200 dma.
Even the October 2023 low did not satisfy a full test of the 200 day following a 3 month down-draft.
The current slide to the QQQ 200 dma took 18 trading days.
That tells you something about the complexion and character of the market we’re in.
So why did the Q’s “come up short of the idealized 418 level, instead rebounding off a low of 423 on Monday?
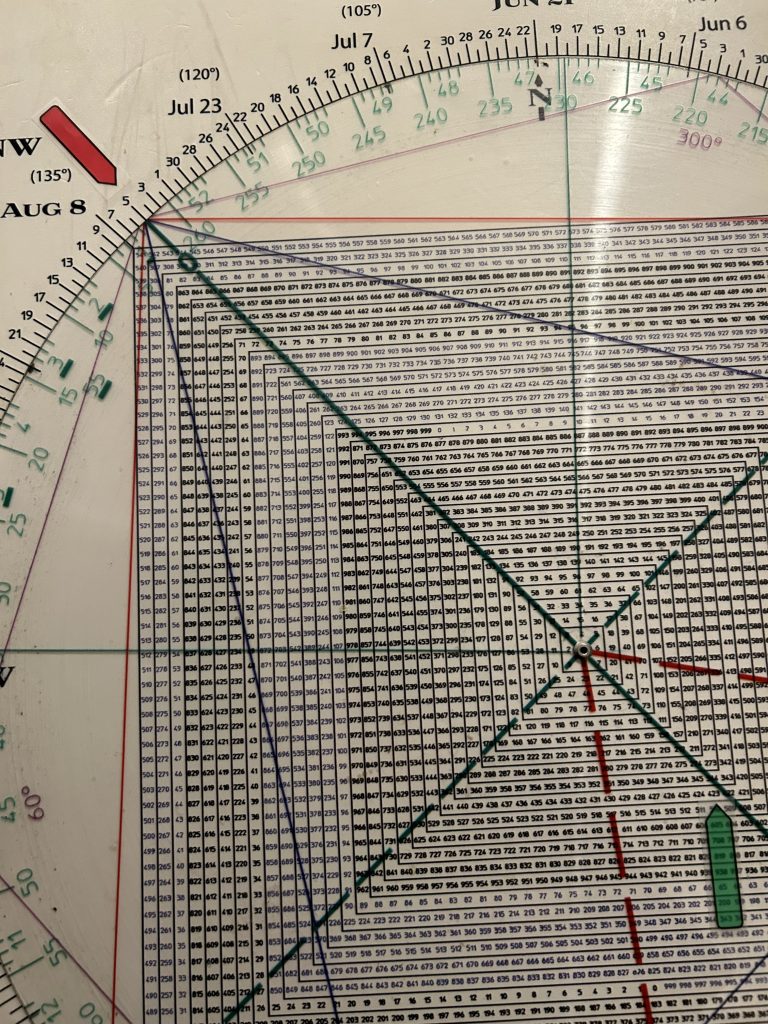
Checking my Square of 9 Time/Price Calculator shows that 423 aligns with August 5th.
You can’t make this stuff up
In sum, we won’t rehash the parallels between the 1929 and 1987 crashes here again.
Suffice to say that the 386 DJIA high from 1929 squares out with October 19th, Black Monday in 1987 and that the year 1987 on the Sq of 9 Wheel squares out with October 29th, The Big Kahuna.
What we want to be mindful of is that in the aftermath of the 1987 crash many were fearful that it was a signal of an economic downturn and crisis.
It was not.
Now following a slide right off the top, few if any are concerned about a economic crisis and market collapse.
I can’t help wonder if the Principle Of Alternation is not on the table.
In other words, 1929 was an earthquake that took the market 25 before a new high was struck.
After the 1987 seismic event the SPX struck a new high after only 21 months.
After the VIX surge in 2020 the market struck a new high after only 6 months.
Above I mentioned the long term cycle factor in the San Andreas Indicator.
It suggest the current slide is not a “one-off” and that it has further to run.
Why?
From the major 1974 bear market low the 50 Year Jubilee Cycle points to 2024 as a “reckoning”.
50 years prior to 1974 is 1924.
While the bottom prior to the Roaring Twenties bull market was in AUGUST 1921, the launching pad for the roaring part of the advance occurred in in the early summer of 192e4.
This is when the DJIA came out of a multi-year Cup and Handle.
We have a potential Low to Low to High Cycle on the table.
This isn’t the end of the turbulence.
It ‘s a tremor.
It is just the beginning of the chaos.
I have been providing market timing and long/short day trades and swing trades in my Hit and Run Newsletter since 1996.
Experienced investors know the value of having the benefit of the intricacies of the market, someone who has proven their ability to call the big turns.
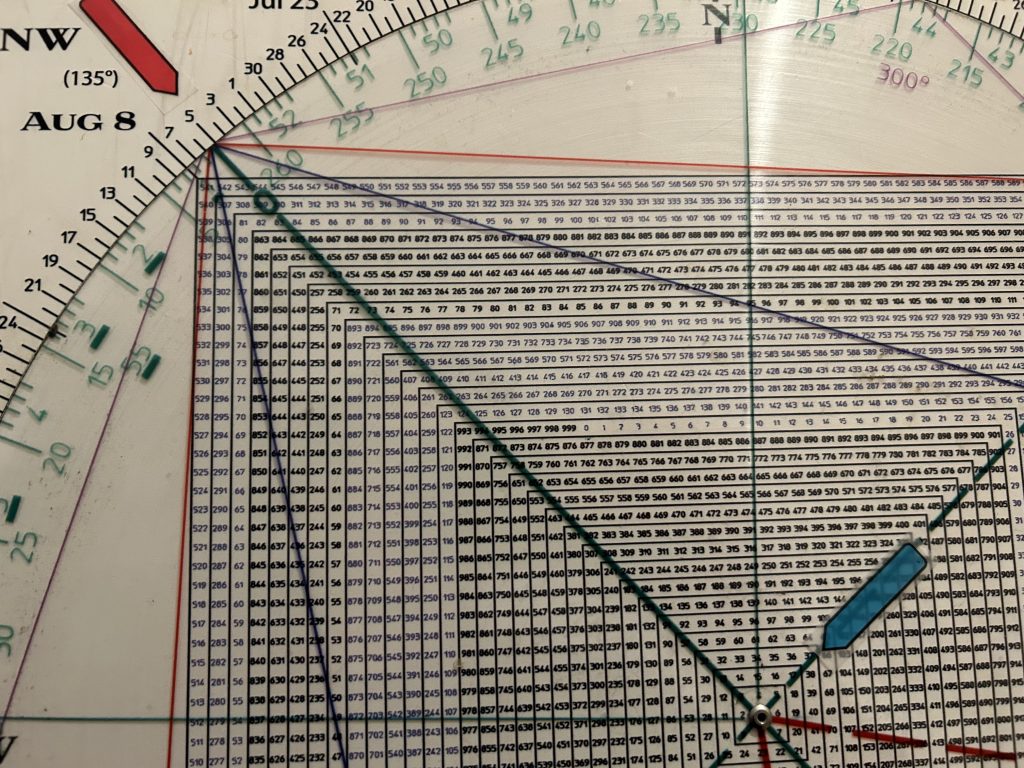
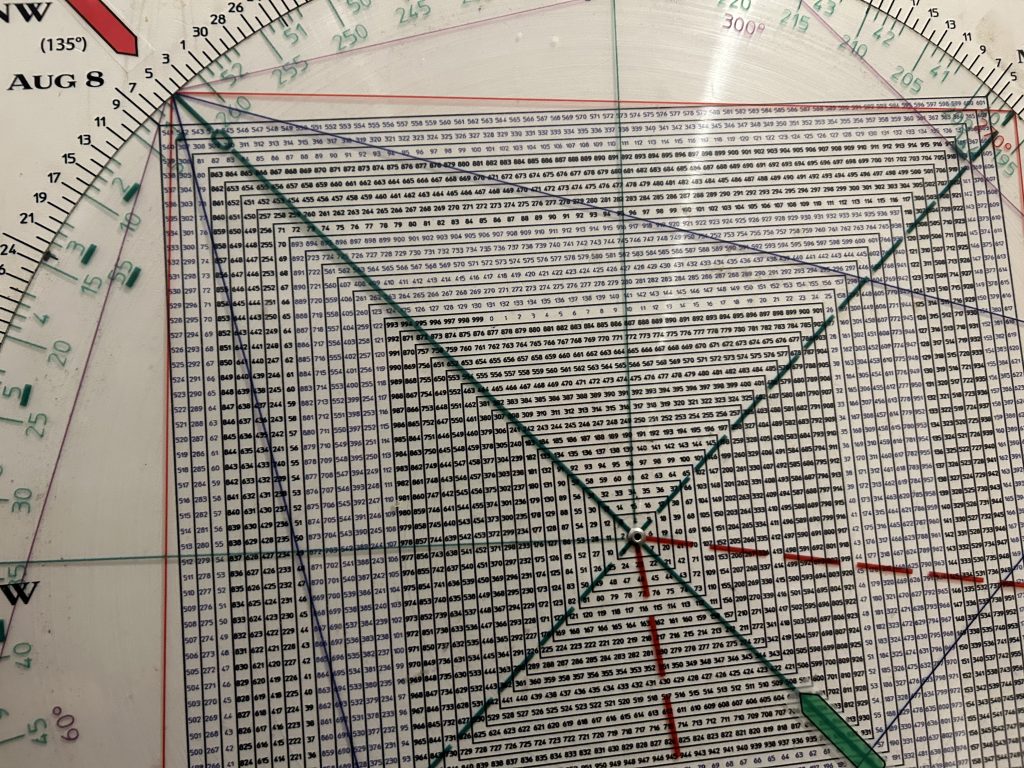
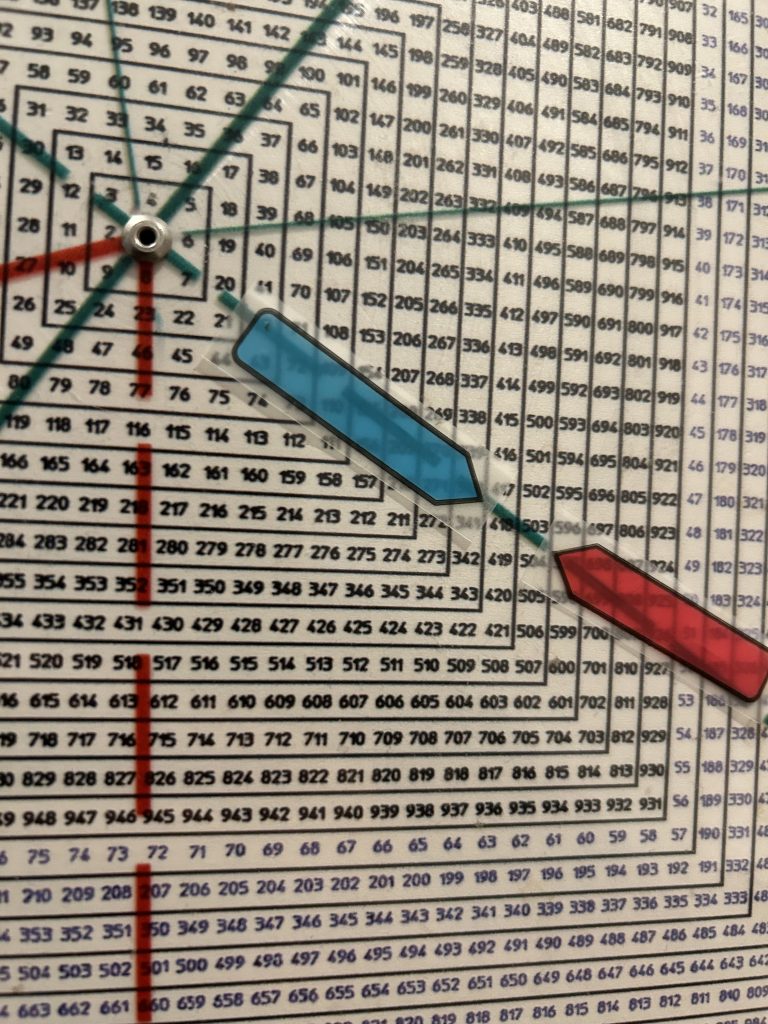
Someone who has decades of experience in the markets, who looks below the surface for the subtle clues using the amazing Square of 9 Wheel combined with my Swing Chart Method, the only fully unified approach to the markets.
This has been the key to helping to catch the most important turns in the market over the past few decades.
Our longtime members tell us nothing compares to our blow by blow analysis allowing us to capture home run gains in the last few days.


The opportunities that lie ahead will be massive.
Buy and Hold is dead. Now is the time to Hit and Run.