With keen observation, recurring patterns can be seen at every Bull Market Cycle peak.
At each cycle top, on the retest of the 50 day moving average roughly one month later the moving average turns down.
It is not just the test of a rising 50 DMA but a backtest of a 50 DMA that has turned down or is just rolling over that reveals Mr. Market’s agenda.
Why is the 50 day MA so pivotal? I don’t know. It may be self-fulfilling in as much as market participants have been keying off of it for so long.
There may be a more intrinsic or esoteric significance to the “50”.
Be that as it may this price action at the 50 DMA confirms that a top of some degree is in and signals the start of a new downtrend.
Checking an SPX through last Friday, January 3, 2025, shows that these characteristics have aligned.
Another close below the 50 DMA currently at 5948 will decline the SPX 50 day moving average.
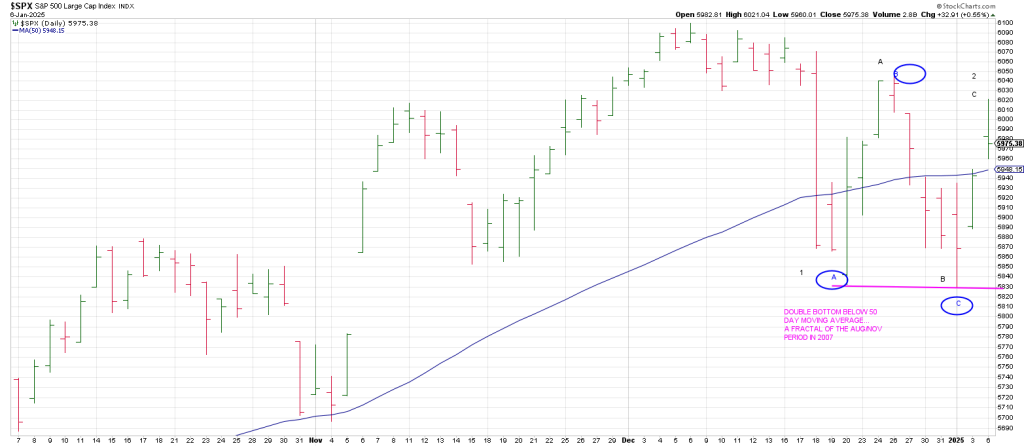
Remarkably the 50 DMA currently ties to the key 5945 level.
As we know, 5945 is 180 degrees down from the SPX 6100 all time high.
Friday the SPX rallied sharply to close right on the 50 day.
Monday it gapped up with authority but tailed off.
Did the bulls snatch defeat from the jaws of victory?
Monday’s Momentum Gap underpinned the monster rally we were looking fo— opening the door to a new all-time head-fake high.
For whatever reason, the market often times puts in these Tombstone Top/ head fake breakouts at final highs.
Monday’s open gap from 5949 to 5960 will figure strongly in the path in this key week.
We will walk thru why this week is key below.
In sum the SPX was up nearly 80 points at Monday’s highs while 10 minutes before the bell the index was up only 18 points before working higher on the runoff to settle up 33 points.
As is always the case (the problem?) with Elliott Wave analysis, there are two conspicuous ways to count the price action off the December 6 all time high.
If the drop into December 19th was a Wave 1, then we could be tracing out an A B C for a bearish Wave 2 prior to a dramatic Wave 3 decline.
Alternatively, the drop into December 19th could be an A Wave decline followed by a B Wave rally into December 26th. Then came a C Wave sell-off into January 2nd.
If the alternate count is correct Friday and Monday’s momentum was part and parcel of a push to new highs.
Let’s compare the current pattern around the 50 DMA in the SPX with that of 2007-2008, the last Bull Market top
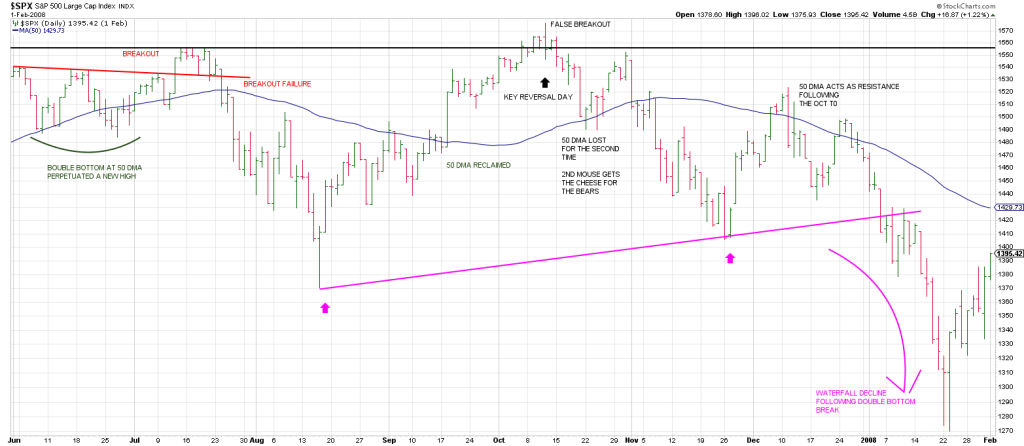
The orthodox high in 2007 occurred in July with a false breakout.
When the breakout pivot failed to hold the SPX waterfalled into August.
The important thing to notice is that the failure coincided with the 50 day MA>
As well note the double bottom at the 50 DMA prior to the July “breakout”.
That is similar to the double bottom at the 50 DMA the SPX has carved out recently…except for one major distinction—now the “double-bottom” is well below the 50 day moving average.
When the 50 DMA was recaptured in September it perpetuated another false breakout into October 11th that marked the final high.
This is the theoretical path the SPX had here in January 2025 to a nominal new high historic top.
While Monday reversed the morning surge, and it looks like the bloom is off the momentum rose,
A new high could still play out.
IF it’s going to it could happen as early as Friday.
Interestingly the SPX carved out a little Head and Shoulders Top formation in October just like the Head and Shoulders the index sports currently.
The SPX reversed on Monday just below the “Right Shoulder” from the key 6020 region but another push through the right shoulder and 6020 opens the door to a nominal new high above 6100.
Remarkably, remember that 90 degrees down from high is 6020 which stopped Monday’s powerful surge dead in its tracks
Amazing.
The point I want to shows is that after the October 2008 high once the 50 day line was lost again a test of the August low played out,
But the critical sign of the bear was when the subsequent rally from the test of the August low
Backtested a declining 50 dy moving average.
That setup led to a break of the double bottoms (magenta) producing a waterfall decline in JANUARY 2008.
So in addition to January 2008 we have a series of momentous Januarys:
January 1966 secular Bull Market top
January 1973 Bull Market top
January 2000 DJIA Bull Market top
January major 2018 and Flash Crash
January 2020 (orthodox Covid pre-crash high_
January 2022 major top
Is a waterfall decline on the table this January?
What we know is that the market top on December 4th to 6th (DJIA vs SPX).
The Gann Panic Window opens January 12-14th.
This is the 49-55 day calendar count that marked the 1987 and 1929 crashes.
There are other such less infamous examples.
What if the SPX strikes a new high while this count is still in progress?
Strictly speaking it destroys the count and closes the Panic Window.
Strictly speaking by the book.
But the market is a sly one and doesn’t always go ‘by the book’.
For example the Covid Crash low count for the low fell between the orthodox Jan 22 peak and the Feb 19th nominal new FAKEOUT HIGH.
The takeaway is IF a nominal new high should play out here don’t assume the coast is clear.
It wasn’t in 2007 or 2000. Or 1973
Additionally, maybe something, maybe nothing, but the DJIA high in 1929 was 386.
386 is 90 degrees square October 19th, Black Monday in 1987.
There was an harmonic vibration between the price high before the crash in 1929 and the day of the crash in 1987.
386 is 180 degrees straight across and opposite January 17th, in the heart of this years Gann Panic setup.
Of course many January 17th’s have come and gone since 1929.
However, the setup of a prior high 49-55 days prior to mid-January wasn’t always on the table as it is now.
That said it is interesting how “386” pointing to January has seen so many January final bull tops.
In sum, we have a double bottom on the SPX well below the 50 day moving average.
Is this a fractal of the double bottom in after the July top in 2007 or is it a fractal of the large magenta double bottom that produced a waterfall decline in January 2008.
A decline below the 50 day moving average now that sticks holds the key to the answer.
Breakage below the double bottom will kick start a waterfall.