
“There’s a place up ahead and I’m going
Just as fast as my feet can fly.” Up Around the Bend, Creedence Clearwater Revival
On the monthly SPX below I created a series of horizontal lines
Marking major highs.
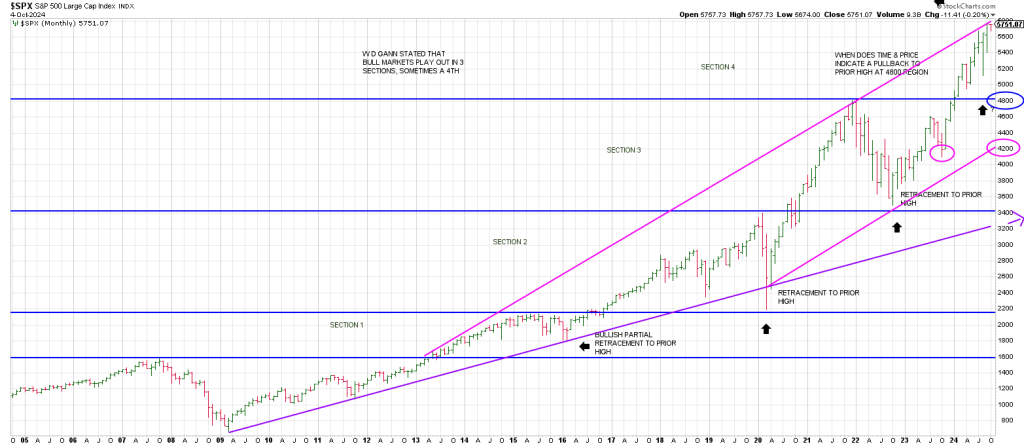
The first starts with the October 2007 peak.
The next is the 2015 high following the breakout above the 2007 high in 2013.
The subsequent advance topped in 2015.
The breakout above the 2015 high produce 3 drives to a high in early 2020. The pre-Covid Crash peak.
The old Wall Street saw goes that prior resistance becomes new support.
That played out with the Covid Crash low basically dropping to the region of the 2015 highs.
The SPX sent two months “on the side” on the rally back to test the early 2020 highs before exploding higher to a top in January 2022.
Once again, the decline that followed the January 2022 top found support at the region of the 2020 peak.
Notice that the SPX once again paused before pushing through the January 2022 peak.
The “Pause” in September/October 2020” was at the prior highs.
The “Pause” into October 2023 occurred below the prior swing high of 2800 (January 2022).
In each case after the strong advance the SPX pulled back to the prior high—except in 2015 when there was only a partial retracement
So where are we now and what is the message of this big picture chart.
W.D. Gann stated that bull markets play out in 3 sections or phases—sometimes 4.
These are not Elliott Waves.
I have defined each section by where it eclipsed the prior highs as shown.
Arguably one could argue that section 1 started from the 2009 low.
In that case, the size of the sections would be relatively similar.
Theoretically, the SPX’s could have culminated its 4th phase.
Why?
I connected the closing monthly low of the Covid Crash with the low in October 2022 (magenta line).
I then paralleled a trendline forward and backwards from the January 2022 top.
Notice that it perfectly nails the breakout in 2013.
The geometry proves this is a good channel.
There are many things that can be gleaned from this one chart.
1) As offered, the SPX may be completing an important top. I believe the market is culminating a long Super Cycle top. Consequently, while the SPX has kissed the top of the magenta channel, the size of this cycle MAY elecit a push above the top of the trend channel. If so it could be a nominal new high, a short-lived Pinocchio or it could be a vertical spike. I don’t know. No one knows for sure. But, there are clues which we’ll get to later.
2) At some point a major reaction targets a pullback to the prior high at 4818.
When that plays out it is going to be critical to observe the behavior because, as offered, we already have 4 sections of phases. Consequently whether we have a further melt-up or not the stage is set for The Abyss in 2026. Yes it can start at anytime but my point is that it will not be a 3 month affair like July-October 2023. It will most like play out in 12 to 18 months.
3) A technical Domino Setup is on the table: breakage below 4800 opens the door to 4200 and the bottom of the magenta channel. Breakage below 4200 points us down to the October 2022 low (3490).
4) Notice that a purple trend line from the 2009 low will intersect the blue horizontal line marking the October 2022 low and the early 2020 high.
The take away is that breakage below 4800 points to a drop to 3500 in 2026
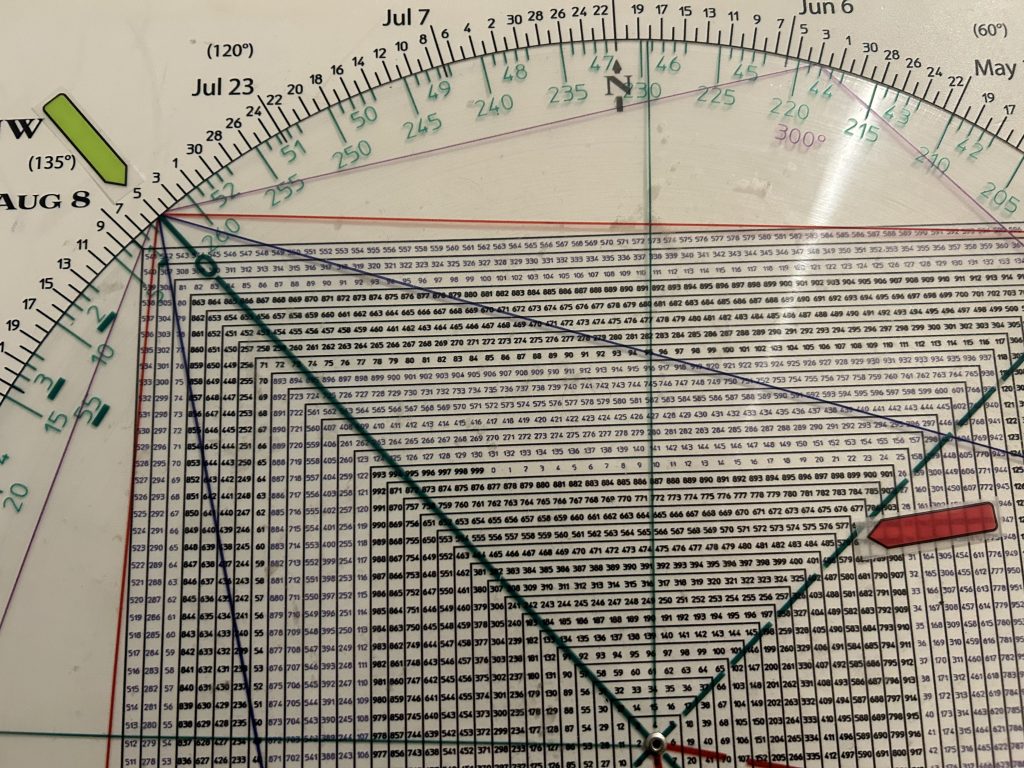
When might that occur? April 8 squares-out with 349 (3490). Late June is opposition 349. Interestingly that is the date of the Great American Eclipse in 2024.
October 11 is square 349. As such obviously, this means the October 2022 low was a Time/Price square-out
July 10 is 180 degrees opposite 349.
July 10th is the all-time high on QQQ.
Amazing.
The one year cycle on the Q’s looms large.
This week is Oct 11th which as we walked through last week is a significant anniversary.
So this week ties to 90 degrees/days from the QQQ peak and roughly 90 days/degrees from the July 16th peak.
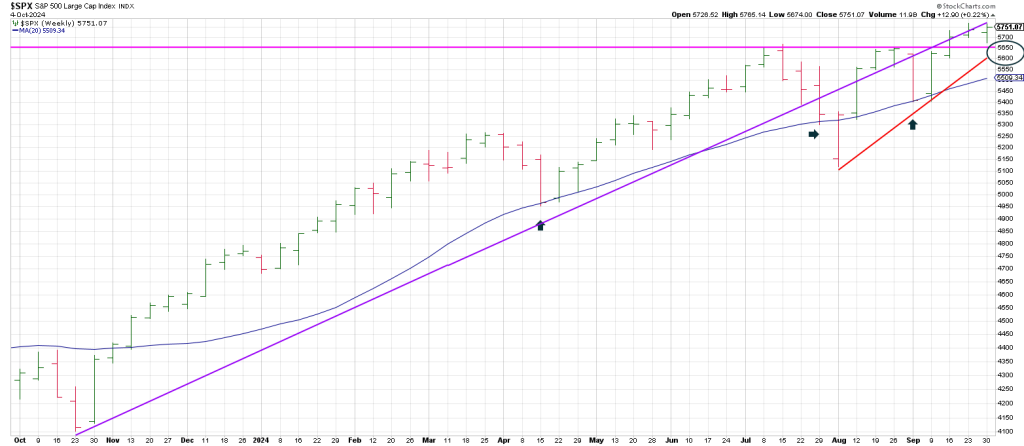
What’s the weekly SPX look like
Coming off the October 2023 low the 20 week moving average had not been tested— until April.
April is 180 days/degrees from the October low so that was an ideal time to look for a peak or a reaction low. We got a low.
The April low was synchronous with a turn down in the 3 Week Chart.
it was the first turndown in the 3 Week Chart since the October 2023 low.
The first time the SPX violated the 20 week moving average was in the early August Flash Crash.
It snapped the 20 week ma with authority BUT CLOSED ABOVE IT on the weekly closing basis.
So early August was the 2nd test of the 20 week moving average.
Once again it was test…and held… on the week of 9/2.
They don’t call it the Holy Grail for nothing.
The trend is the friend, until it bends at the end.
The trend as defined by the 20 week moving average is bending.
Markets play out in three’s.
Either the SPX has 3 higher tests of the 20 week moving average which is going to elicit a further melt-up…or alternatively, breakage of the 20 week moving average over coming days/weeks indicates an important top is in.
Failure below the summer tops of 5650-5660 that sticks suggests a test of the 20 week ma is on deck.
Notice that another drop to the 20 day also breaks the weekly trend line connecting the August and September lows.
So we have a possible Technical Trifecta Domino in place:
- The summer highs
- The Bottoms Line (red)
- A 4th break of the 20 week moving average
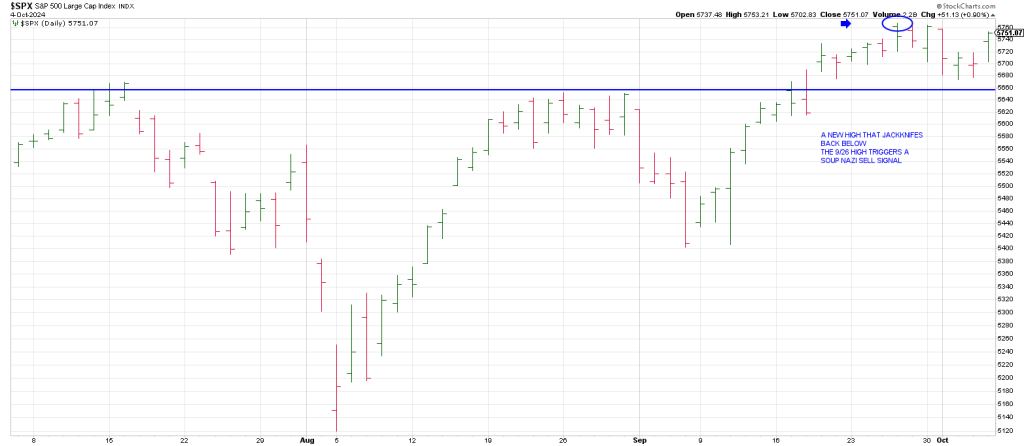
This week is also important because the dailies show that a new high followed by an immediate reversal will trigger a Soup Nazi sell signal.
This is a new 20 day high that Jackknives back below the prior high within the 20 day lookback with at least a 4 day interval. A new high early this week followed a reversal satisfies the Soup Nazi criteria.
As well, 577/578 (5770-5780) squares out with August 5th —the Flash Crash low at 5119.
In sum if a further melt-up is on the table we should know before the week is over.