“I don’t care how many letters they sent
The morning came, the morning went
Pack up your money, pick up your tent
You ain’t goin’ nowhere.” You Aint Goin’ Nowhere, The Byrds
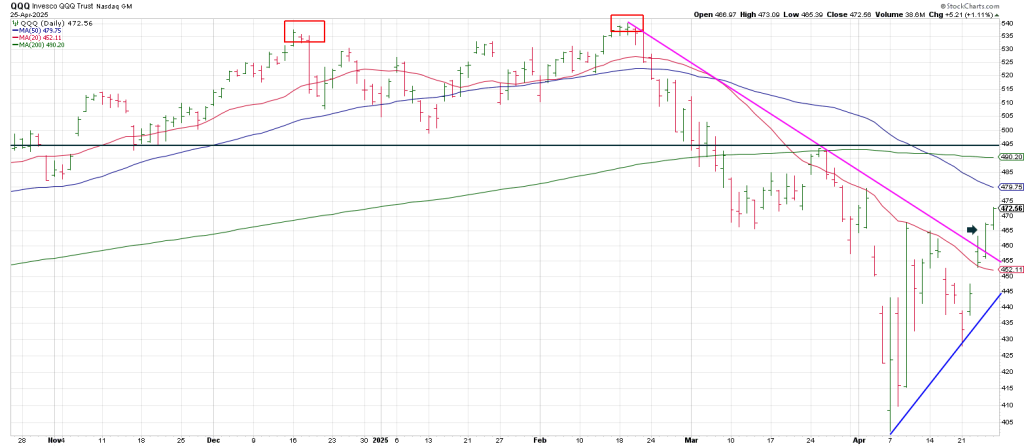
Today I want to focus on the Q’s.
Their pattern is similar to that of the SPX, but the Time/Price square-outs may give us different pivots.
First let’s look at the QQQ Weekly Swing Chart.
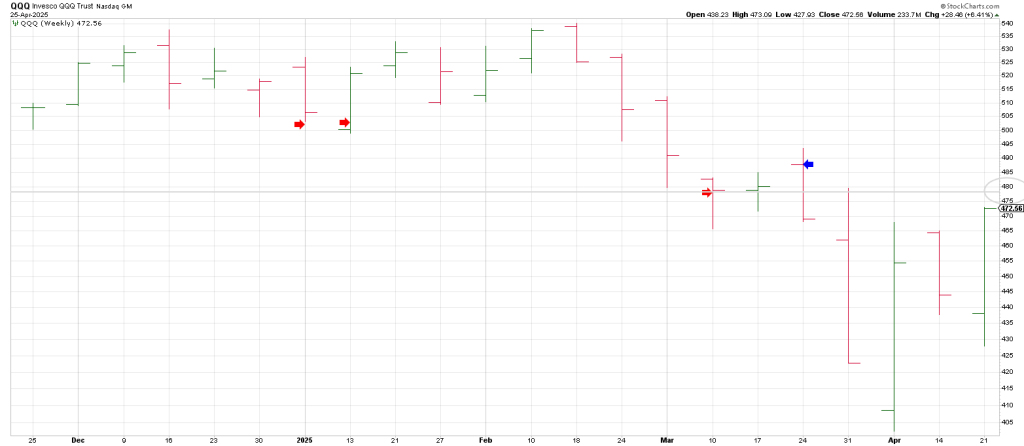
The Q’s turned their 3 Week Chart down directly off the high, a formidable double top formation with the mid-December high NINE weeks apart from the mid-Feb high.
The 3 Week Chart turned down directly off the Feb all-time high.
Notice that the 3 Week Chart also turned down directly off the mid-December high which was a Key Reversal Week.
In a long advance we’ve seen since October 2022 the normal expectation from a turn down in the 3 Week Chart following a Primary High (December) is for at least a knew-jerk reaction…and a test of the highs or even a marginal new high…a Pinocchio.
That’s what the QQQ produced in mid-February.
The second turn down in the 3 Week Chart occurred on the week of 3/10.
It too produced a knee-jerk rally, a rally which traced out a weekly Minus One (3 Week Chart is down)/Plus Two Sell setup (2 consecutive higher highs while the 3 Week Chart is pointing down).
In sum, the second turn down of the 3 Week Chart after a ‘test failure’ of the highs was the Sign of the Bear.
Notice the drive to turn the 3 Week Chart down following the double top was powerful—the Q’s snapped their 50 week moving average for the first time since recovering it in March 2023.
In other words the Q’s glided above their 50 week moving average for 2 years.
The QQQ turned its 3 Week Chart down on trade below 480.53.
The market has a very good memory.
The Q’s have clawed their way back impressively off the April 7th 402 low.
The 475 to 480 region is likely to be staunch resistance.
Why?
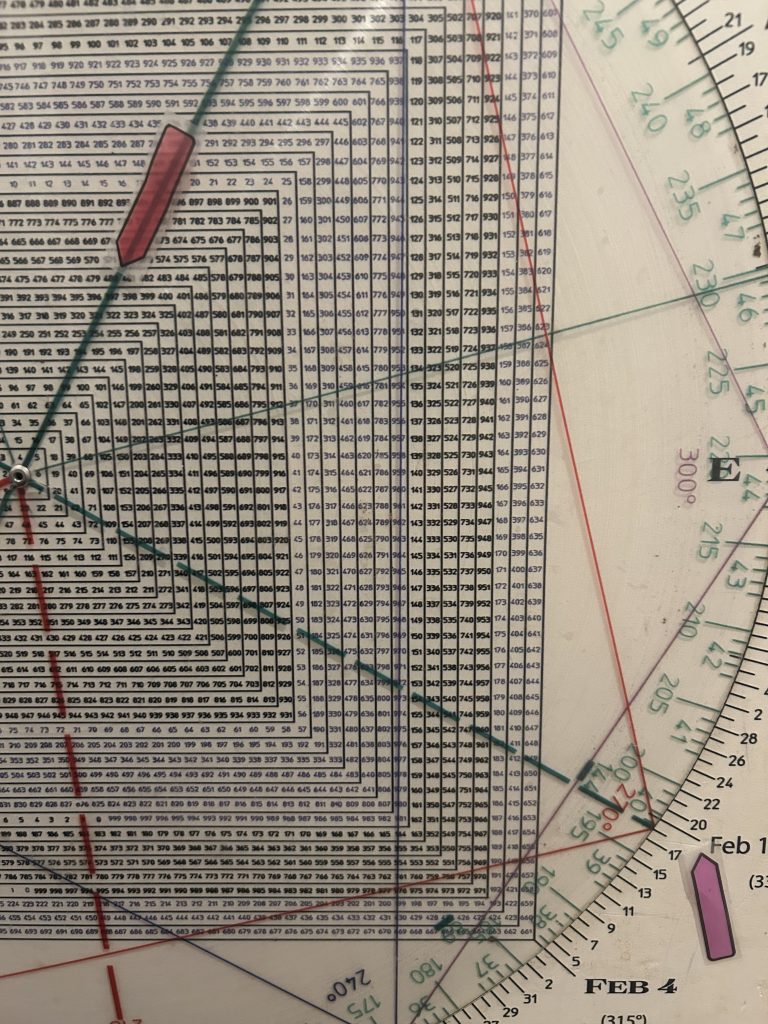
1) 475 is 180 degrees straight across and opposite December 16th the Primary High
2) 480 is 90 degrees square the Feb 19 Secondary High

Does that mean the Q’s have to trade to 475-480?
Not necessarily; time is more important than price.
Although it would be neat if the Q’s traded to 480 as that is where the declining 50 day moving average is sitting and where the 3 Week Chart turned down in March.
However, the 402/403 low points to (conjuncts) April 30/May 1).
As well, looking at time/based price, trade above last weeks high this week puts QQQ in the weekly Minus One/Plus Two sell position.
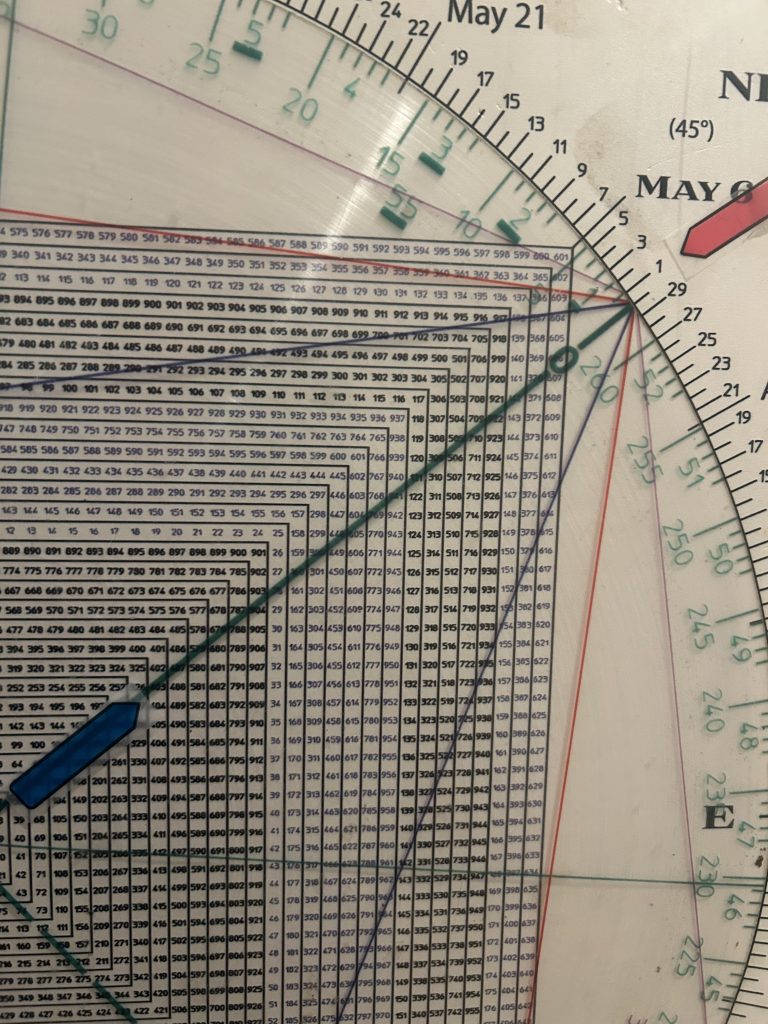
I have shorter term Gann Cycles that point to the last week in May as a like trading low.
In addition late May is 90 days degrees from the Feb 19 peak.
The aforesaid 480 region vectors the last week in May.

For those reasons I think the likelihood is late May is probably a trading low versus a high.
Additionally, May 2 is 270 days/degrees (9 months) from the important August 5th 2024 waterfall low.
Unless the market turns down right here, the likelihood is this May 2nd time frame points to a high.
The Roadmap for today indicates a sharp turn to the downside after an early rally attempt.
There are three reasons that suggest the April low is important…all the more reason why breakage of this months low opens the down door.
1) We’ve got weekly Train Tracks in early April …large range week straight down followed by a large range week straight up.
2) Last week the weeklies turned down defining a low and turned the weeklies up leaving a large range outside up week
3) The decline into the April low tested the November 2021 high
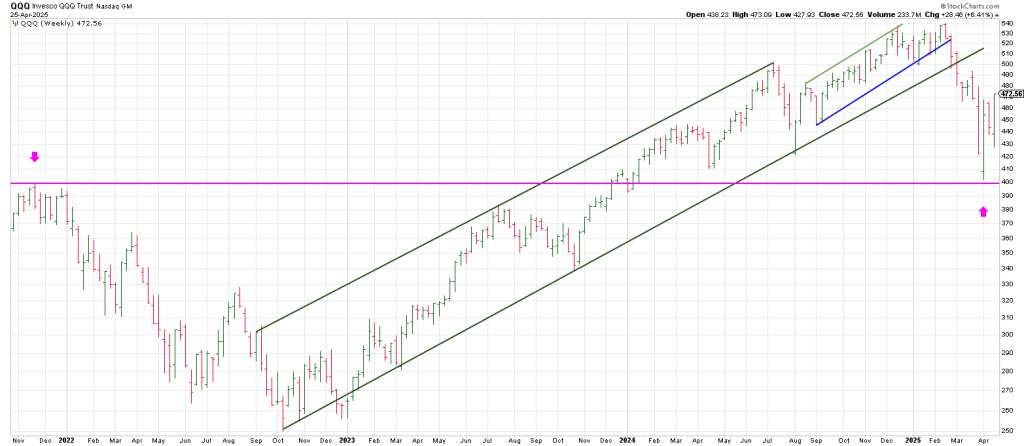
The Q’s have retraced 50% of the year’s range at 471/472, closing right at the level on Friday.
So the nature of the next pullback is going to have a lot to say about the balance of 2025.
My expectation is a pullback starts this week. If the late May turning point is correct perhaps we get a turn back down of the 3 Week Chart.
Will the next pullback reverse below last week’s outside up week?
Will the next pullback take out the weekly Train Tracks and this year’s low?
If my cycles are correct a pullback this week could be brutal —just as traders think the coast is clear with last weeks momentum.
As well intraday bounce backs within the scope of a downdraft could be brutal.
Checking a daily QQQ shows a turn up in the 3 Day Chart on Thursday.
This is the first turn up in the 3 Day Chart since it turned down right off the Feb 19 all-time high.
It will be interesting to see if we get two consecutive lower daily lows this week for a daily +1/-2 buy setup.
90 degrees down from this 473 region is 451 which ties to a pullback to the 20 day moving average.
That fits with my expectation for a 4 to 5% pullback this week.