The market traded in a narrow range last week.
The SPX declined to the bottom of a well defined triangle and bounced.
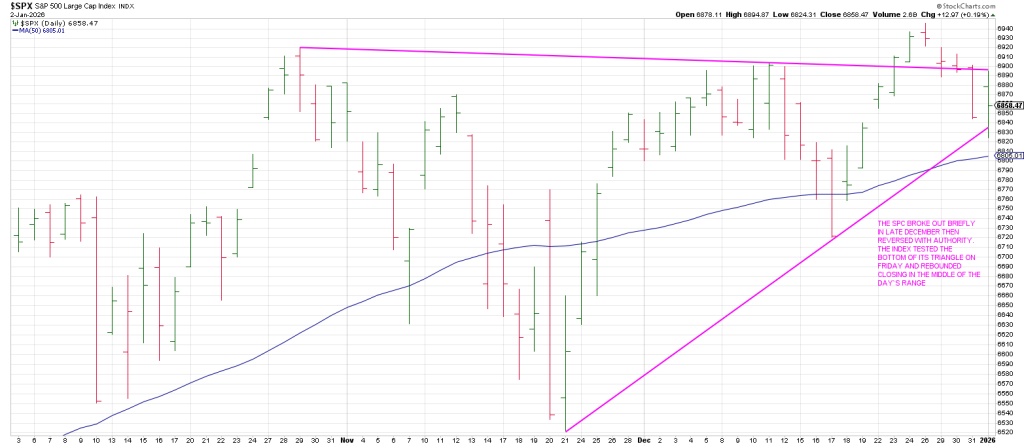
Holding the bottom of the triangle—for the moment— averted a Triangle Pendulum sell signal.
This is because the SPX briefly broke out above the triangle in late December and quickly reversed with authority.
Breakage below the bottom of the triangle would/will trigger a Triangle Pendulum sell signal—
A false break out one side of the triangle followed by a reversal through the other side.
An hourly SPX shows a potential pattern of 3 Drives to a Low.
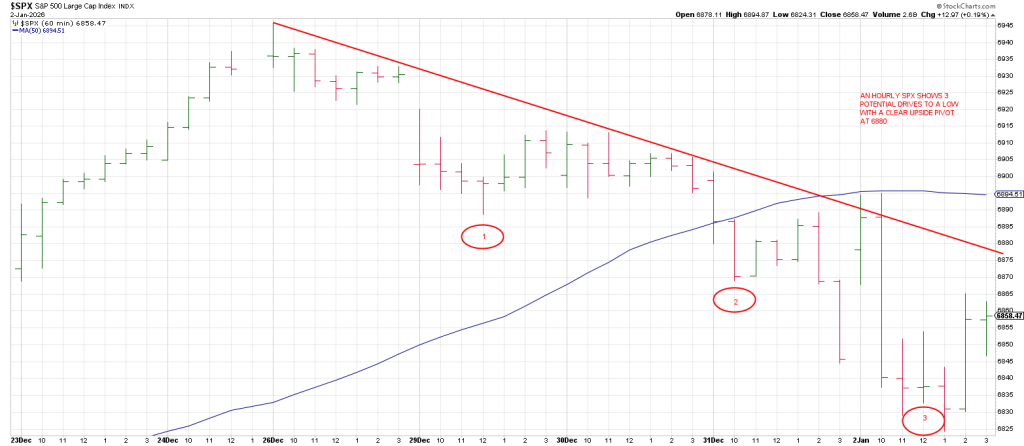
The upside pivot is 6880.
The QQQ also tested the bottom of its triangle; however, it closed below its 50 day moving average on the important Friday weekly closing basis.
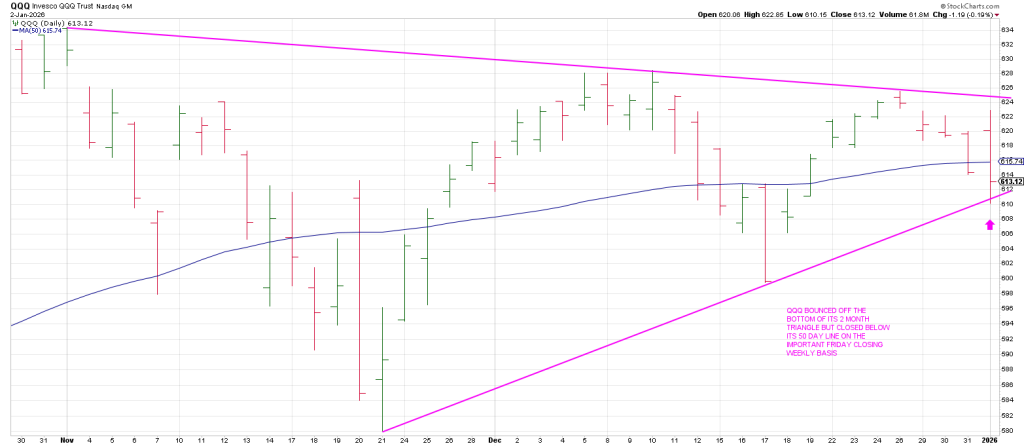
Both the SPX and the Q’s have 3 point trend lines above and below now.
One way or the other we’re likely going to get a Rule of 4 Buy or a Rule of 4 Sell on both this month. It is unlikely they will continue remain coiled in their respective triangles throughout January…especially with the natural cycles and market cycles we’ve outlined recently.
The 3 Week Chart on the SPX is still pointing up.
The 3 Week Chart on the Q’s turned down on the week of November 17 and remains down.
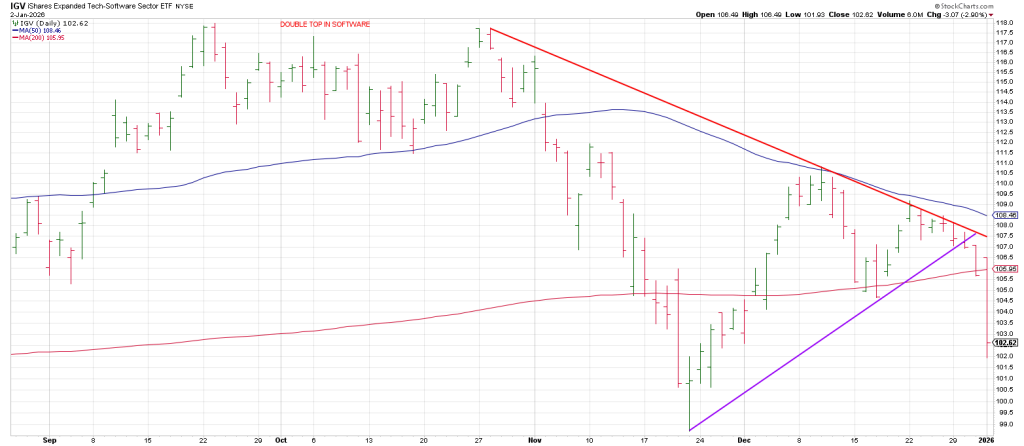
Underpinning the tension on the tape is the fractured behavior in tech between the chips and software stocks…SMH and IGV.
Let’s take a look.
SMH broke out to an all-time intraday high on Friday just shy of a closing all-time high.
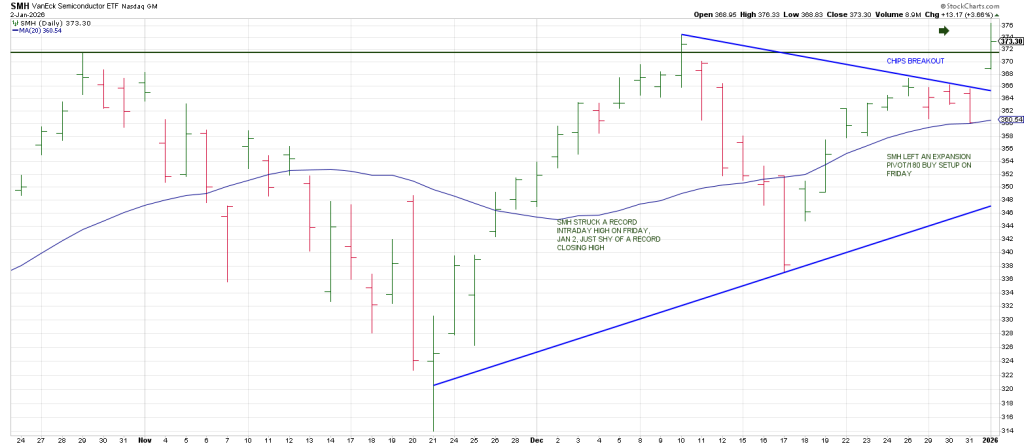
The breakout was across the board led by names like MU, LRCX and TSM.
Other tech names came out. Names include WDC, TER, COHR and SNDK.
In contrast the software ETF, IGV, plunged below its 200 day moving average led by culprits such as TEAM, WDAY, ADBE and OKTA.
If we’re going to get a push to a new all time high in the SPX it should start this week.
That said I think it will be a last hurrah if it happens.
Time is running out.
History shows that late-cycle advances driven by narrowing leadership and deteriorating internals tend to end abruptly, not benignly.
The unraveling of the Nifty Fifty in the early 1970’s followed this same pattern:
Leadership rolled over first, breadth collapsed next and price eventually followed. Markets did not consolidate sideways to resolve the imbalance. They repriced—forceful over time.
Near term the time frame around January 11 is potentially pivotal.
It is the anniversary of the false breakout top in 1973.
That’s 53 years ago.
53 is on the Cardinal Cross on the Square of 9 Wheel and aligns with 690 (6900), a level the SPX has been defining resistance on the SPX for nearly three months.
Tomorrow’s report will showcase why cycles indicate why 2026 should be the year that ends the longest bull market in U.S. history.
We will address where price confirmation sounds a warning and what level signals a long term bear market.