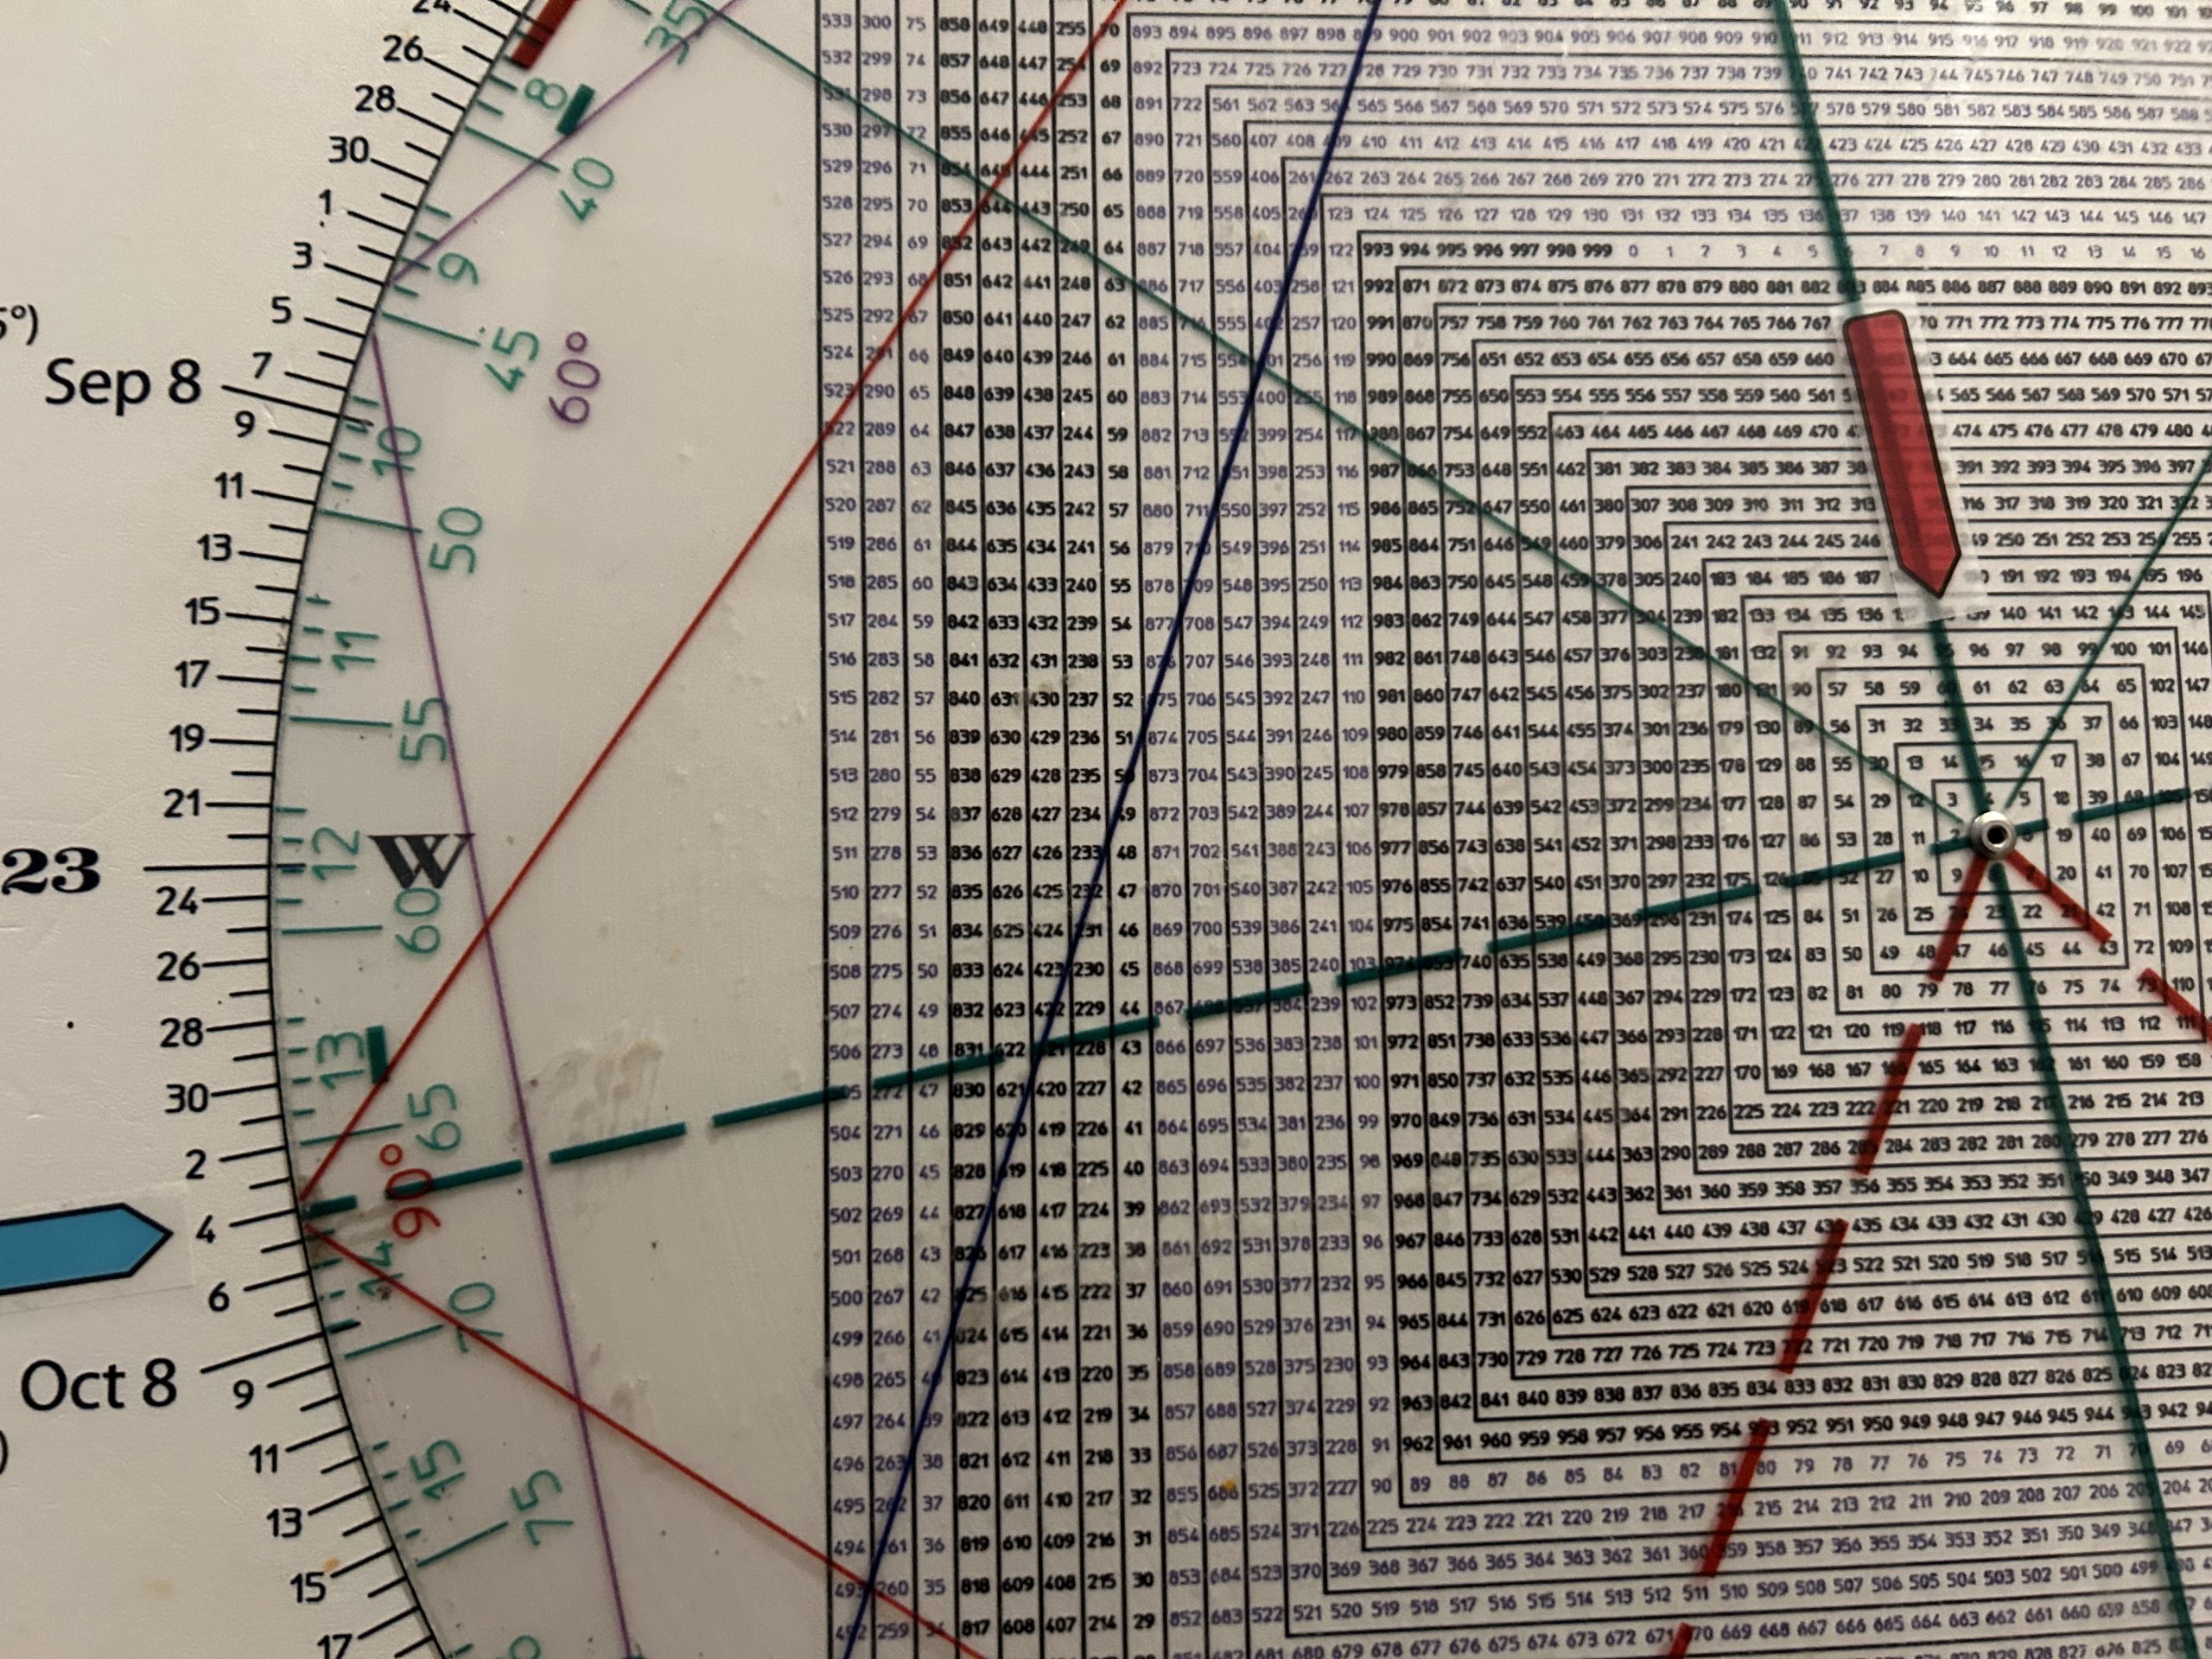
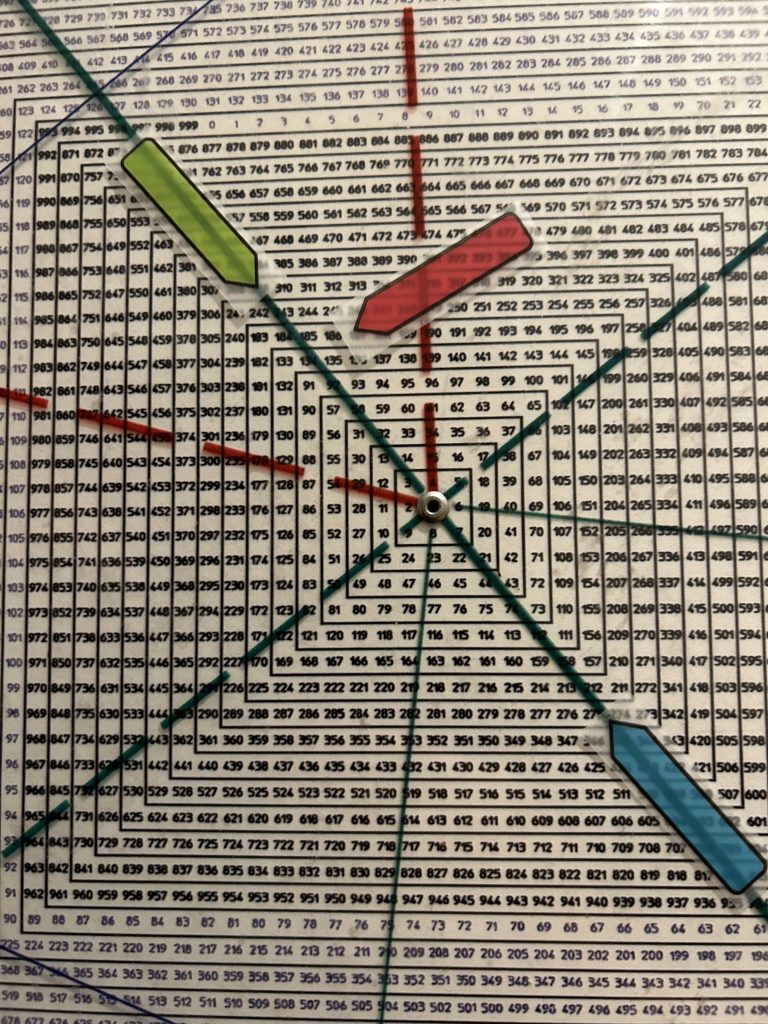
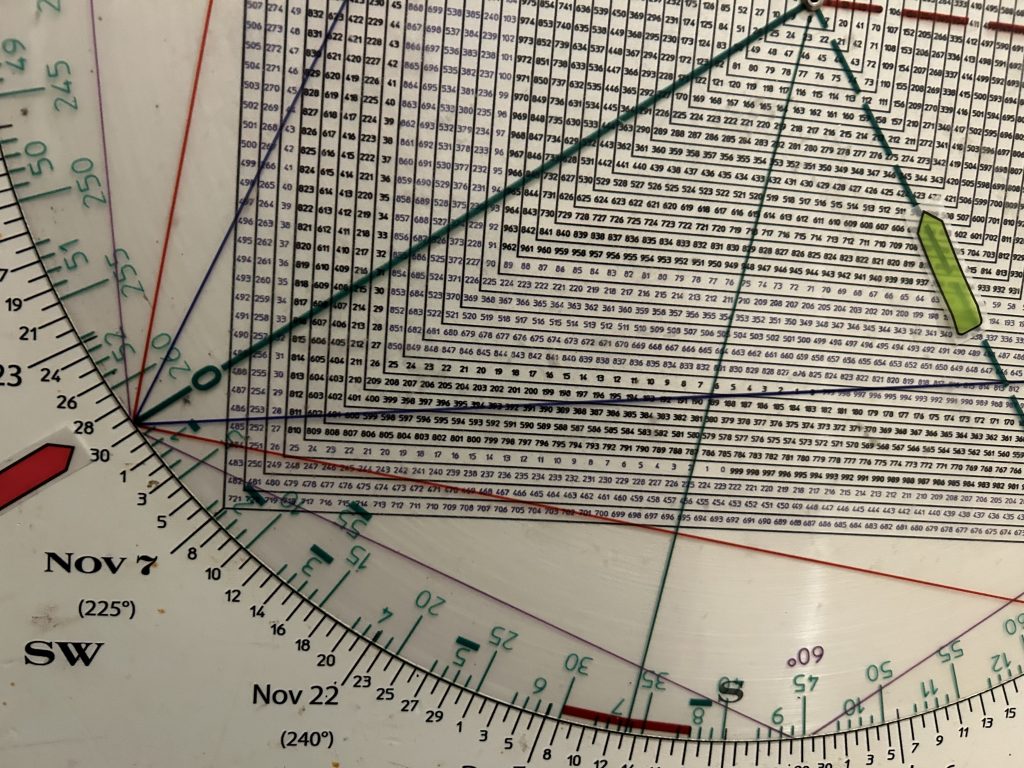
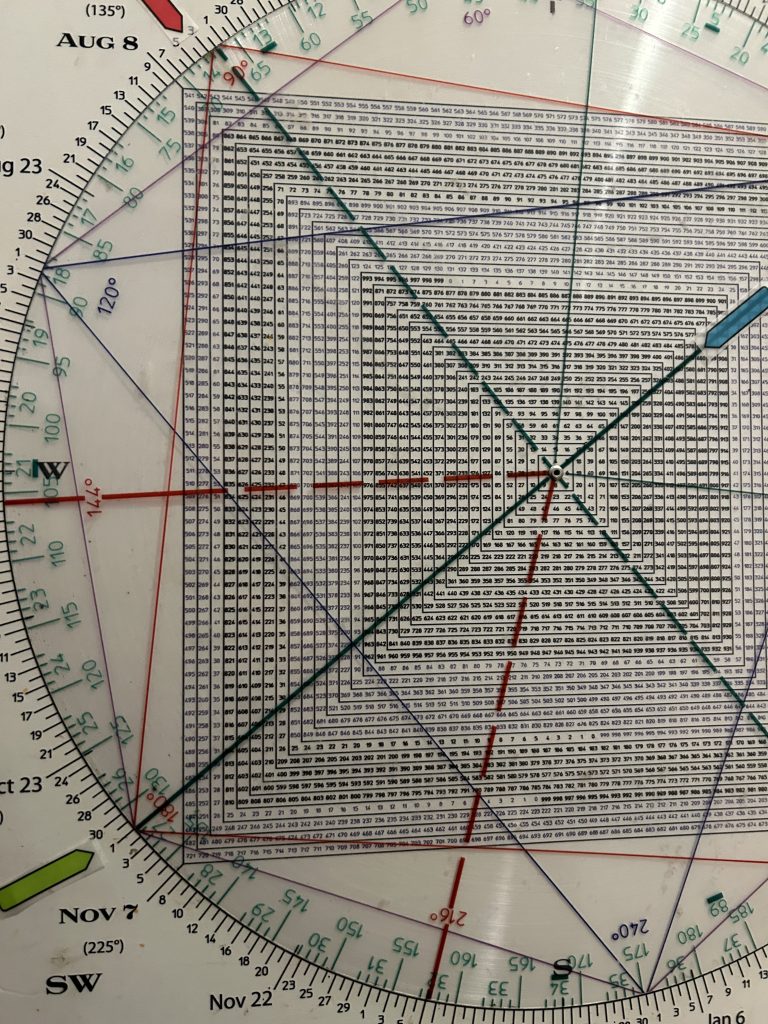
The Square of 9 Wheel is many things but in its purest form it is a Time/Price Calculator.
Many assume the secret to W.D. Gann’s forecasts was that he was an excellent astrologer.
However, Gann wrote, “Astrology is helpful in financial markets but math is more important.”
What does “math” in the markets mean?
Gann theory is based on the idea that all major highs and lows are related in time AND price and that there is a common harmonic that influences past, present and future stock market movements.
Gann argued that all market action has historical reference points. He found that market events and specific numbers repeated across time cycles.
He found that the vast majority of trends occur in periods of three days, three, weeks or three months.
Gann also saw the calendar year of 365 days as an important cycle.
This is a basic geometric natural circle or cycle.
It takes the Earth 365 days to complete one revolution around the Sun.
So there are 4 period of 3 months (90 degrees of the circle) in a year.
A square has 4 sides so the natural cycle of one year “squares the circle”.
To understand Gann theory, you must accept that the markets are cyclical in nature.
Essentially, the news (the fundamentals) breaks with the cycles, not the other way around.
Gann’s great discovery was that integrating Time and Price allowed him to predict trend change.
He used time and price independently, but when they balanced out or squared-out there is a strong likelihood of a change in trend.
This is especially true when a market/stock moves sharply into such a time/price confluence.
15 years is an important cycle because it is 180 months or one-half of a 360 degree circle in months.
Why is this important? Because the ancients told time using the moon or moonth.
So 360 months or a circle of months is 30 years.
What happened 30 years ago?
In November/December 1994 the market ignited in a 60 month advance into late 1999.
The DJIA made a closing monthly high in December 1999. The SPX and NAZ ran 90 days/degrees or 3 months square to November 1999 topping in March 2000.
What happened 15 years ago? The market struck a major bear market low in 2009.
In sum, I have projected that a major bull market top would occur in 2024.
Why?
2024 is half the 30 year cycle and 90 degrees square or 1/4 the Master 60 Year Cycle.
We’re not going to go into the significance of why Gann called the 60 year cycle his ‘Master Cycle’ at this time again as we half in the past for Hit and Run members.
Suffice to say that March 2024, 15 years from March 2009 saw an initial high and that 6 months or 180 degrees opposite saw a closing monthly high in September.
It didn’t look like we’d get a closing monthly high in September in keeping with the 95 year cyclic anniversary of the 1929 September high.
But…Thursday was the last trading day of October and while it didn’t look like September would set the closing monthly high for the bull 24 hours ago, Friday’s drop made it so.
Now we will only know in the fullness of time whether September will mark the monthly closing high for the bull, but I think there is a strong likelihood it will…even if we get a Squeeze Play following the election to a new intra-month high in November.
I doubt November will close better than September’s high if I am correct about Time/Price synchronicities at play.
Checking a monthly SPX shows September closed at the high of the month at 5762.
October closed the month lower at 5705.
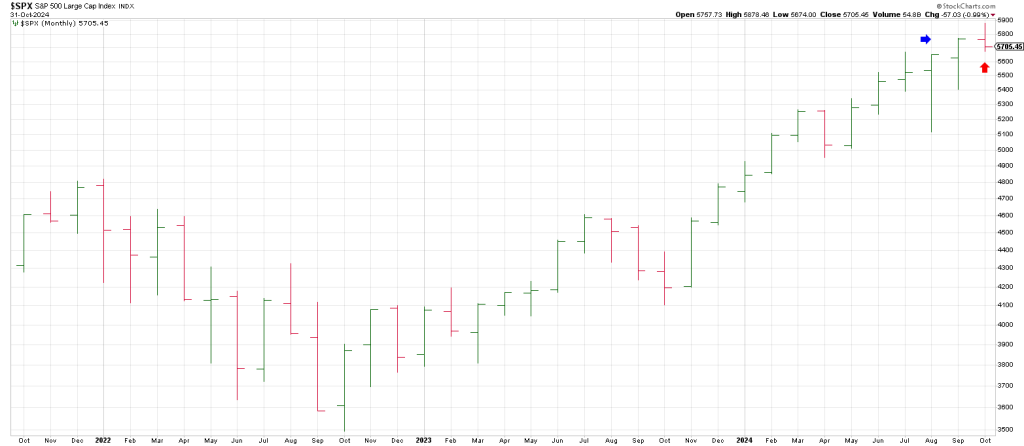
The DJIA closed September at 42,330. October’s close was lower at 41,763.
Just hours ago, on Wednesday, it looked like a fait accompli that the SPX would close at a new monthly high as on Wednesday the index closed at 5813…well above September’s monthly close of 5762.
But October had a date with destiny. With just one day to go the infamous Mr. October exerted his influence
Above I mentioned the 95 year synchronicity with 1929.
- The DJIA price high in September 1929 was 386.
386 squares-out with October 17th. If October 17th remains the high on the SPX the market’s talking. Even if we should see a short-lived spike above 386 and a quick reversal, the synergy will remain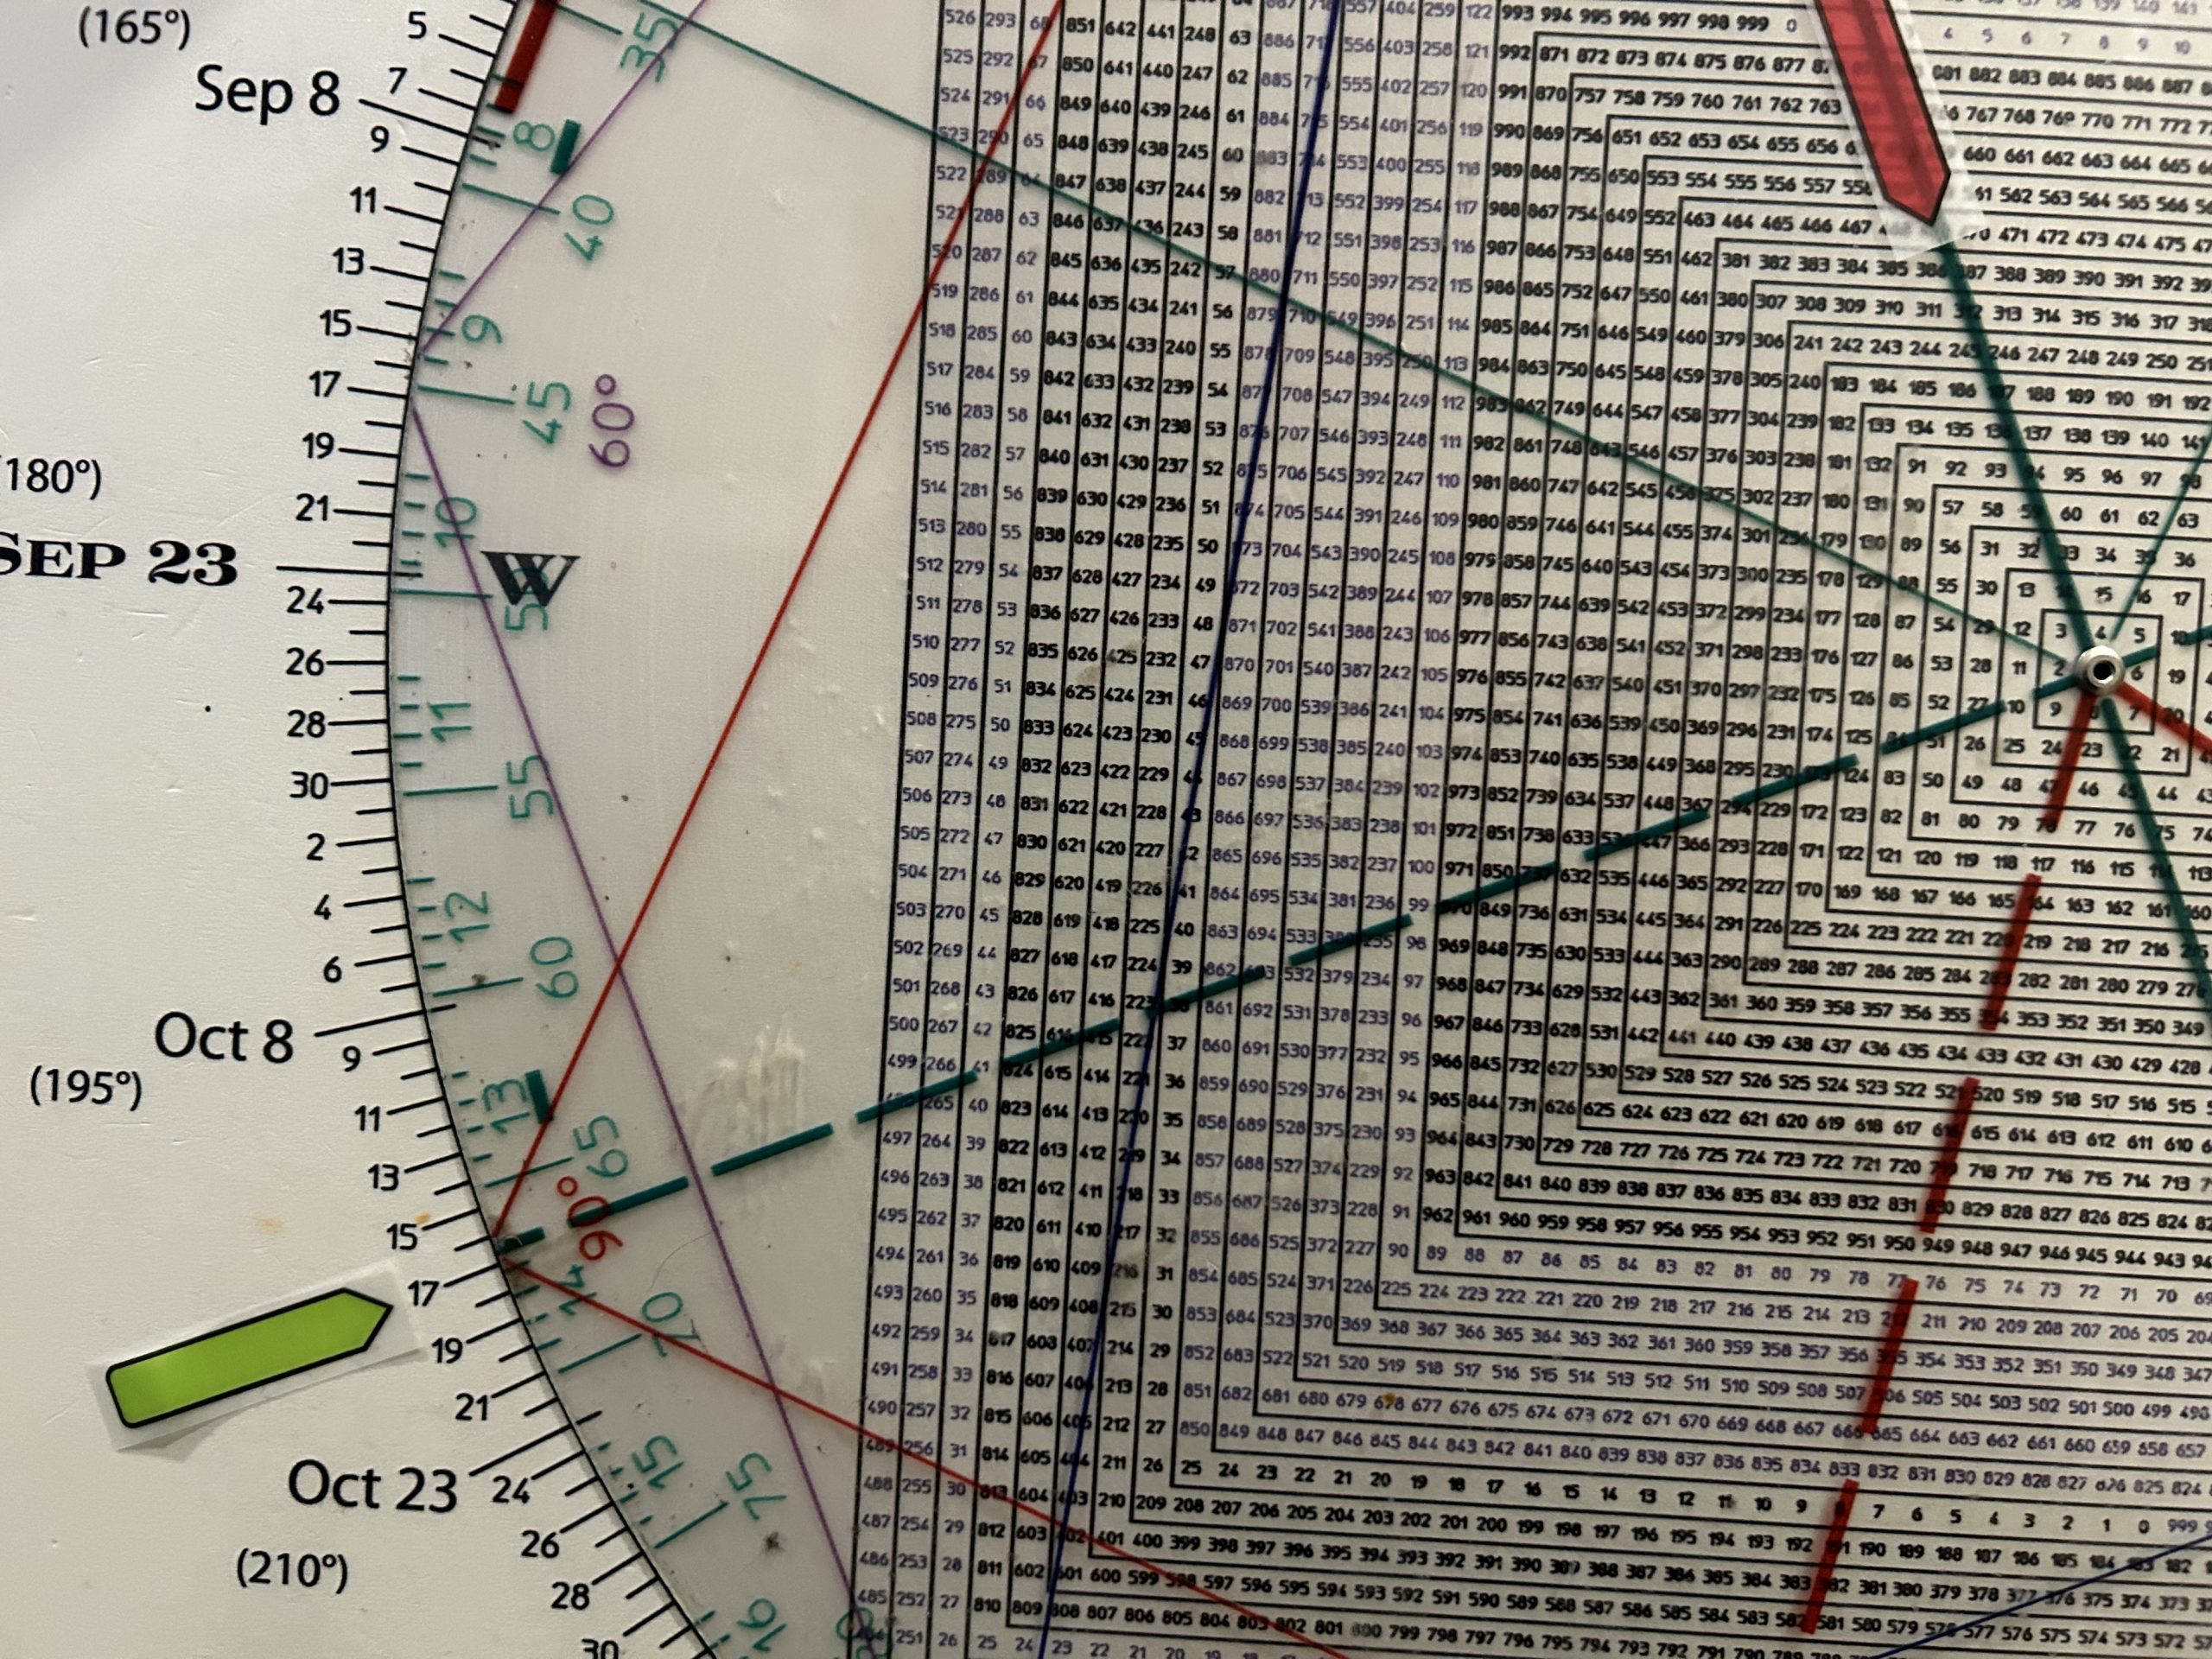
- 1929 was 95 years ago. 95 squares-out with October.
That’s big picture stuff, but it gives the context of how we make money day to day at Hit and Run.
Below are some examples of actionable ideas alerted on the Hit and Run Private Twitter/X Feed over the last 2 days.
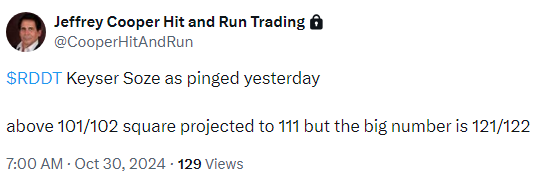
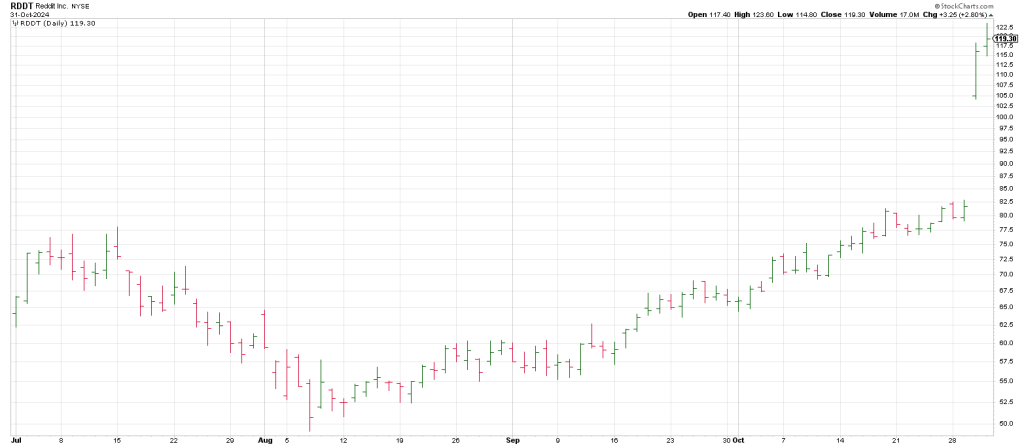
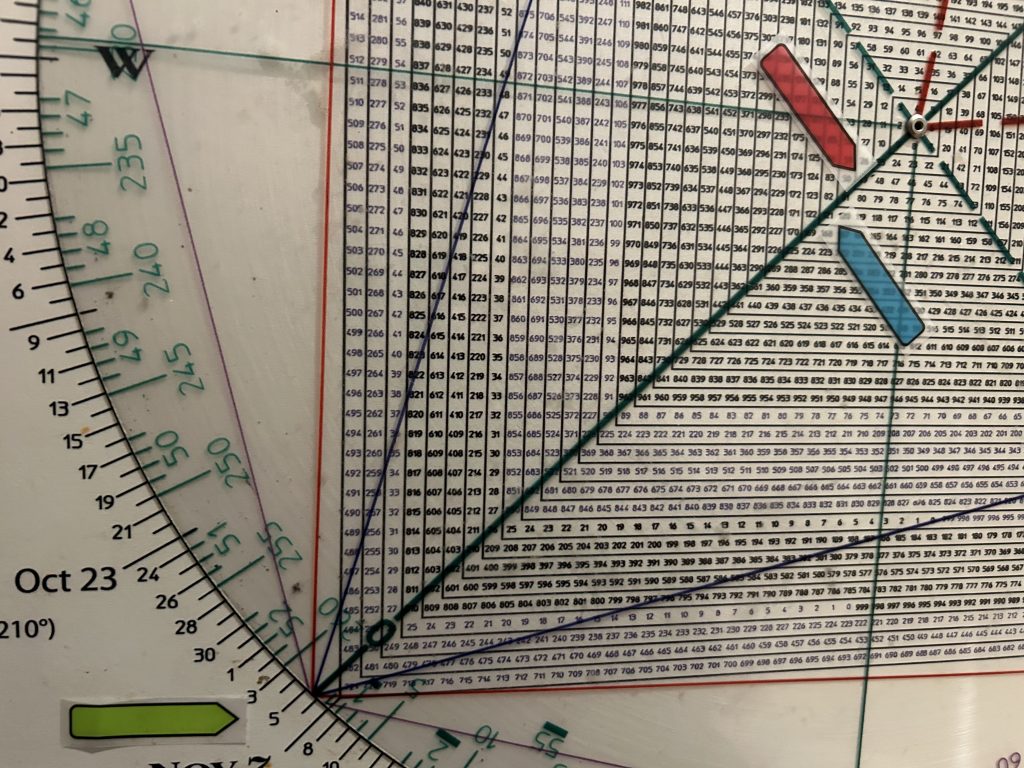
RDDT exploded after earning’s on Wednesday gaping open at 105 and looked extended but we posted that the Sq of 9 Wheel indicated it would push to 121. It did.
From the early August low of 49 an advance to 121 is two cycles of 360 degrees higher.
49 and 121 are on the same ‘axis’.
Note how they point to this time frame.
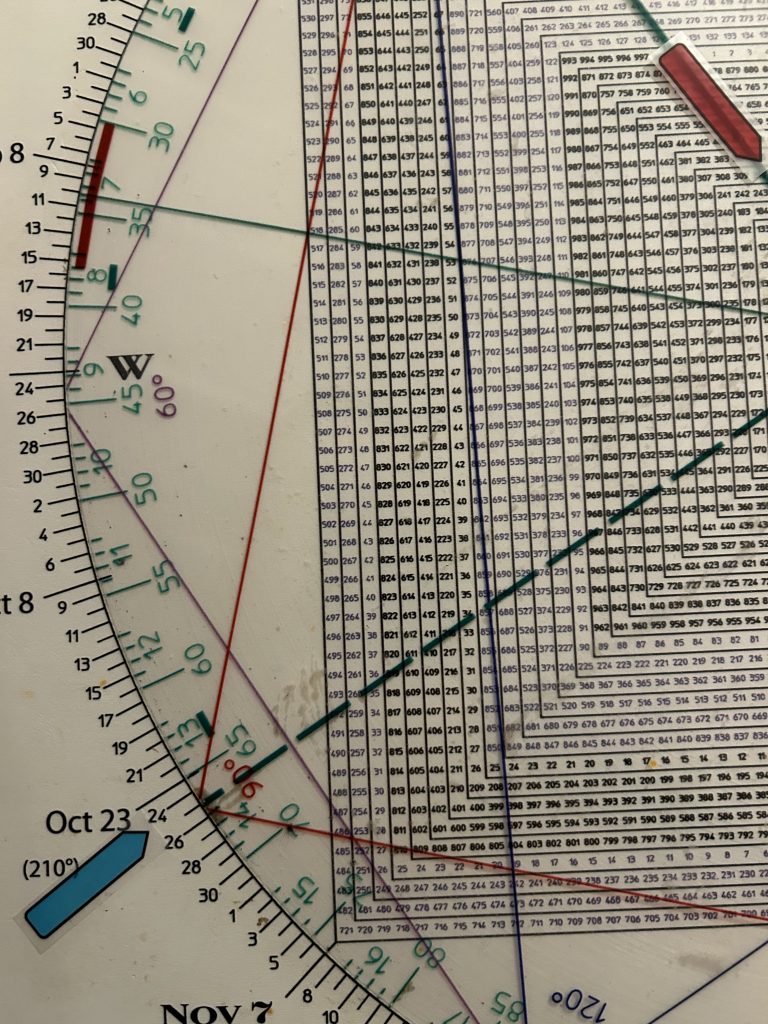
On Monday Hit and Run shorted CROX at 137.90. Why? It was in the Minus One/Plus Two sell position on a backtest of its declining 50 day moving average and was carving out a 3rd lower high. Fast moves often come from 3rd lower highs. It did. CROX announced earnings and the stock tanked opening below 114.
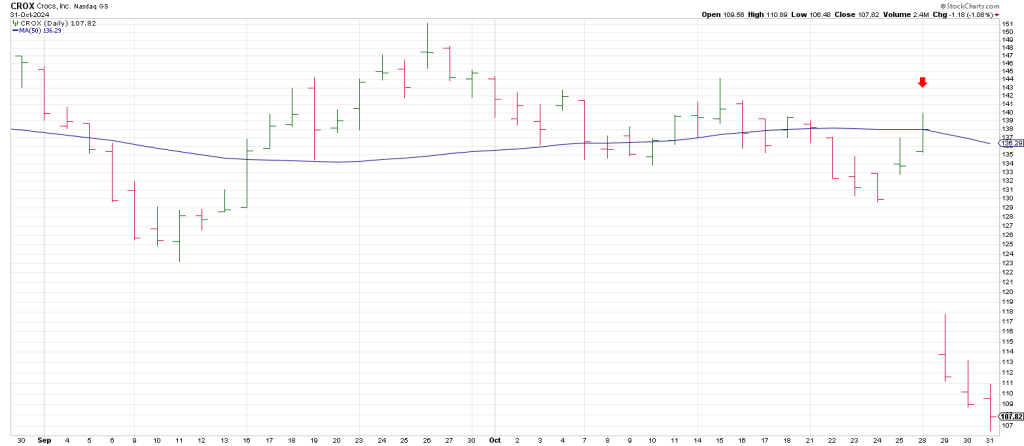
Another example of Hit and Run setups using the Square of 9 Wheel.
We shorted LULU on the spike on October 25th because Oct 25 squares out with 310.
LULU Pinocchio’d 310 but reversed to close at 302.50 leaving a signal bar reversal. Thursday LULU struck a low of 294. That is another example of the Square of p Time/Price Calculator.
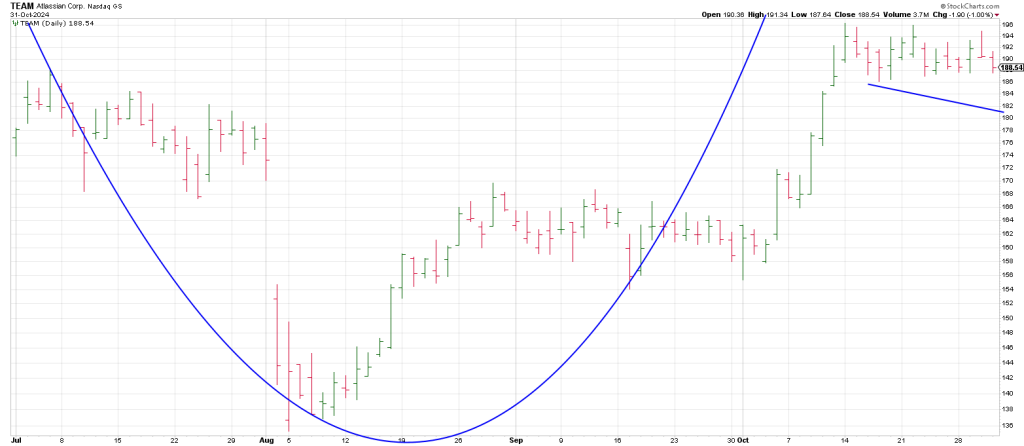
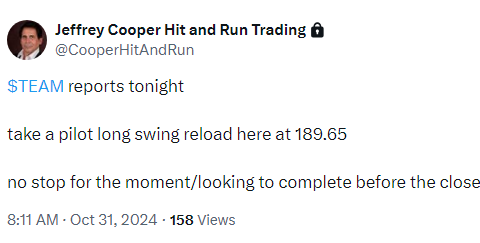
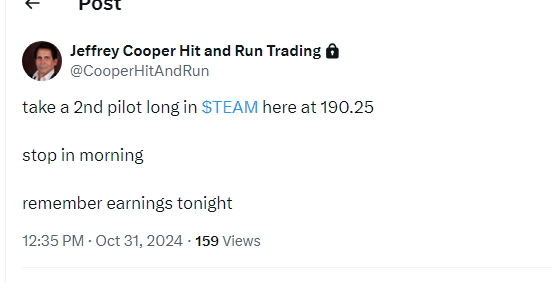
Hit and Run played TEAM long into earnings after the bell Thursday largely based on a beautiful Stein & Handle and a Bull Flag in conjunction with a projection to at least 212.
Above 212 opened the door to 226 and above that 242.
This morning TEAM is up 38 points to 227.
On Wednesday Hit and Run members bought QQQ November and December puts as well as SPY puts for today. We sold the November SPY puts and SPY puts and trimmed the Dec QQQ puts.
The Q’s struck a low of 423.50 on August 5th.
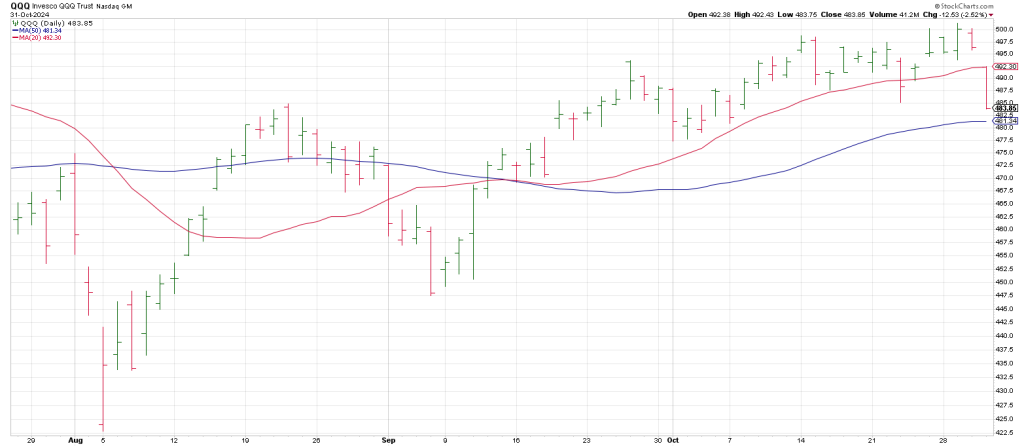
423.50 squares-out with October 29th. Time points to Price. Price points to Time. At turning points they become ‘one and the same’. They balance out.
Amazing.
It looked liked the Q’s were ready to explode on October 29th. But the price action showed a possible 3 Drives to a High pattern.
Yesterday, The Q’s left a Breakaway Gap below their 20 day moving average signaling a trend day down.
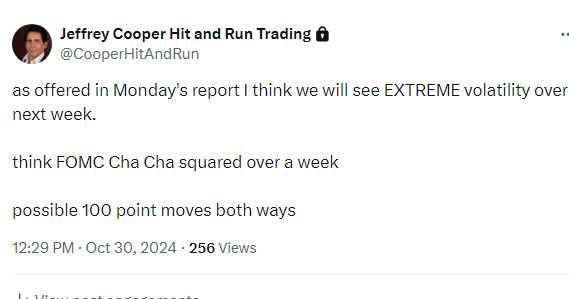
This was in league with our note yesterday reiterating that this week would see extreme volatility….looking for 100 point moves potentially both ways.
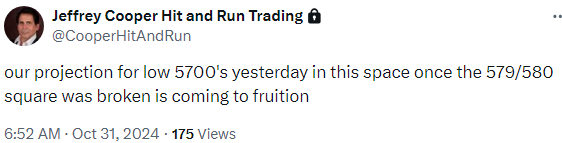
One of the reasons for this forecast was the 6 day Line Formation at the SPY 20 day moving average at 579/580.
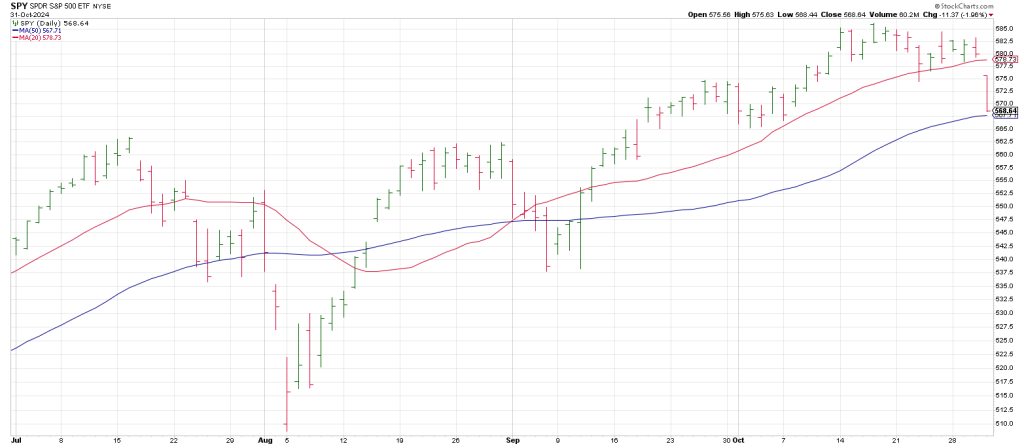
579/580 squares out with the August 5 low and October 30th. Consequently, we offered that breakage below 579 would see a flush to 570 region.
Why? Because we were squaring out with the Flash Crash in early August and the pattern suggested a similar vibration would ripple thru the markets.
Gann wrote that 7 is the number of time and panic. The 6 day ‘flat’ at the SPY 20 day with META and MSFT on deck suggested to me that the reaction to the reports would perpetuate a break of the 20 day moving average.
We got a Gap & Go below the 20 day and the SPY became a heat seeking missile for 570 and the 50 day moving average.
In sum, if you can’t measure risk, you can’t manage risk.
In this regard the Square of 9 is the best trading tool on the planet.
Speculation is anticipating the anticipators.
The Square of 9 in tandem with multiple time frame and pattern analysis is the best anticipator I have ever found.

Square of 9 Wheel
Purchase your own Square of 9 Wheel. Shipping to US only. Contact Jeff for shipping outside the US.