“I’m looking through you, where did you go” I’m Looking Through You, The Beatles
“I can calculate the movement of the stars, but not the madness of men.” Sir Isaac Newton
“The fluctuation of share prices is roughly proportional to the square root of the price” Sir John Templeton
Not all signal bars are created equal.
When you combine a pattern/signal bar with a moving average such as the 20 or 50 DMA as well as
A square-out on the Square of 9 Wheel, you’ve got a potential big winner.
CRDO knifed below its 20 DMA on August 19th followed a large range reversal from all-time highs on August 13
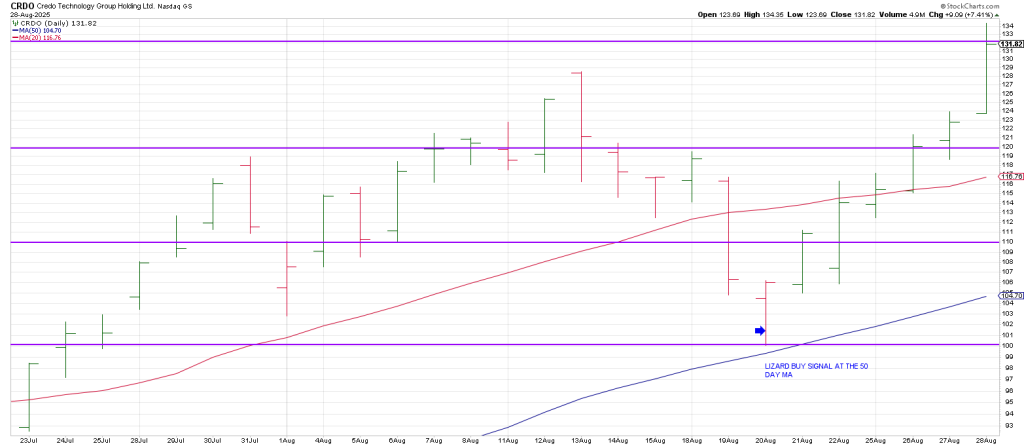
The plumb line drop tested the 50 DMA for the first time since it was reclaimed in late April.
The first time a stock does something such as tests the 20 or 50 DMA after a long stretch is typically a buy opportunity.
The test of the 50 DMA left a Lizard buy signal.
This is a strategy I created in the 1990’s that works just as well in today’s markets.
A Lizard is a new 10 day low with the open and the close near session highs after a flush out.
CRDO struck 100 on August 20. 100 squares-out with August 20.
Taken together there was a synergistic setup pointing higher.
If the trend were down CRDO would have found resistance at its overhead 20 DMA.
The key was that the 20 DMA had not rolled over.
CRDO paused its 20 day but exploded over it on August 26.
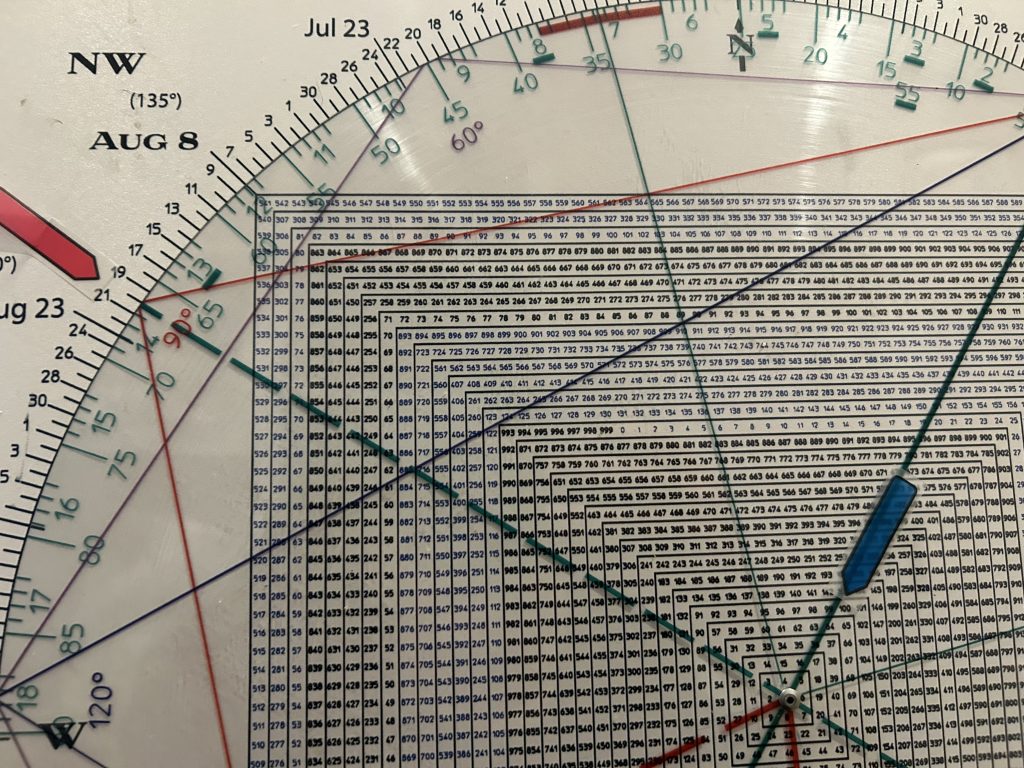
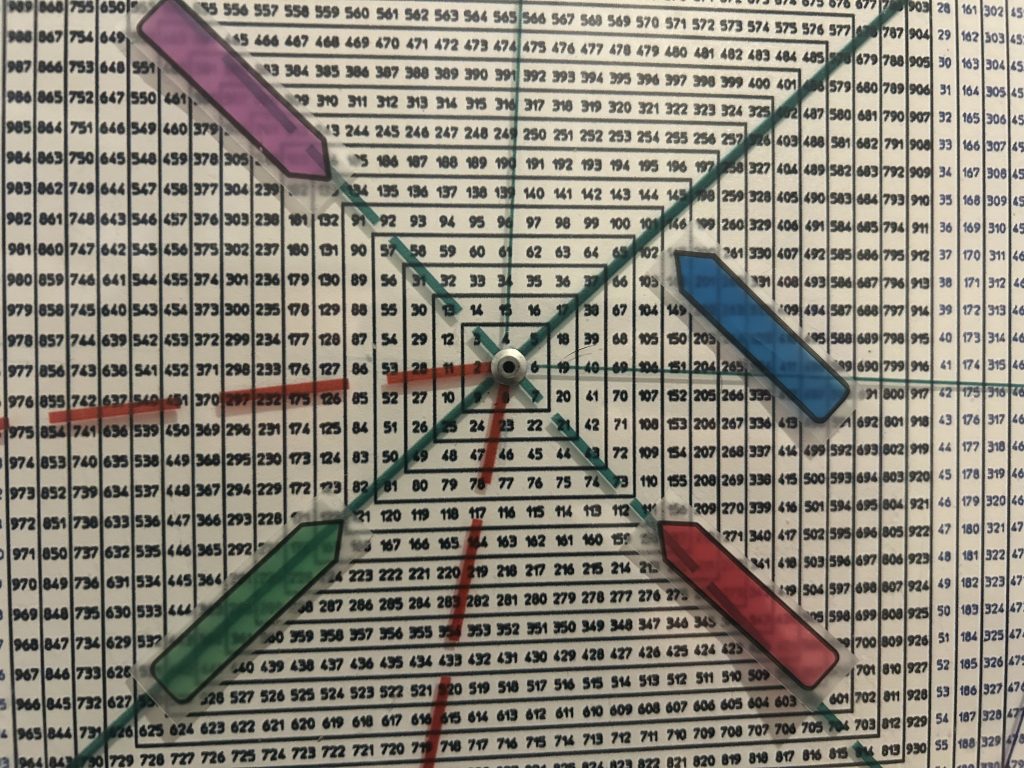
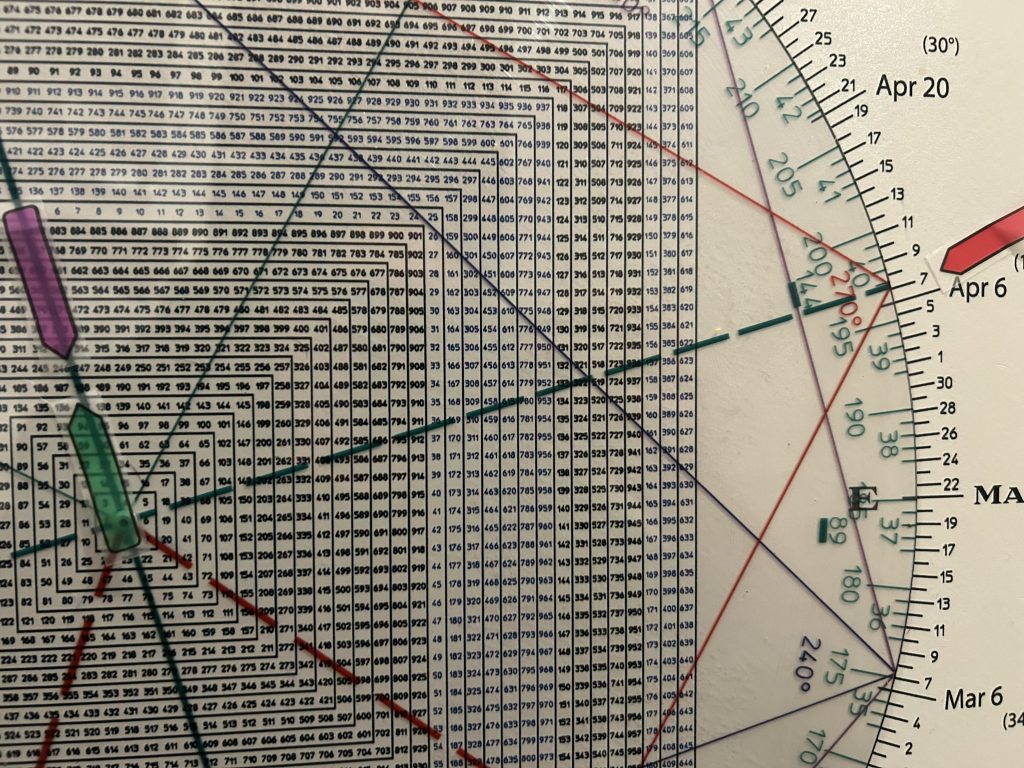
In sum the Principle of Squares as depicted on the Square of 9 below shows
90 degrees up from the 100 low = 110
180 degrees up = 120
270 degrees up = 132
A full 360 degree decrement higher = 144

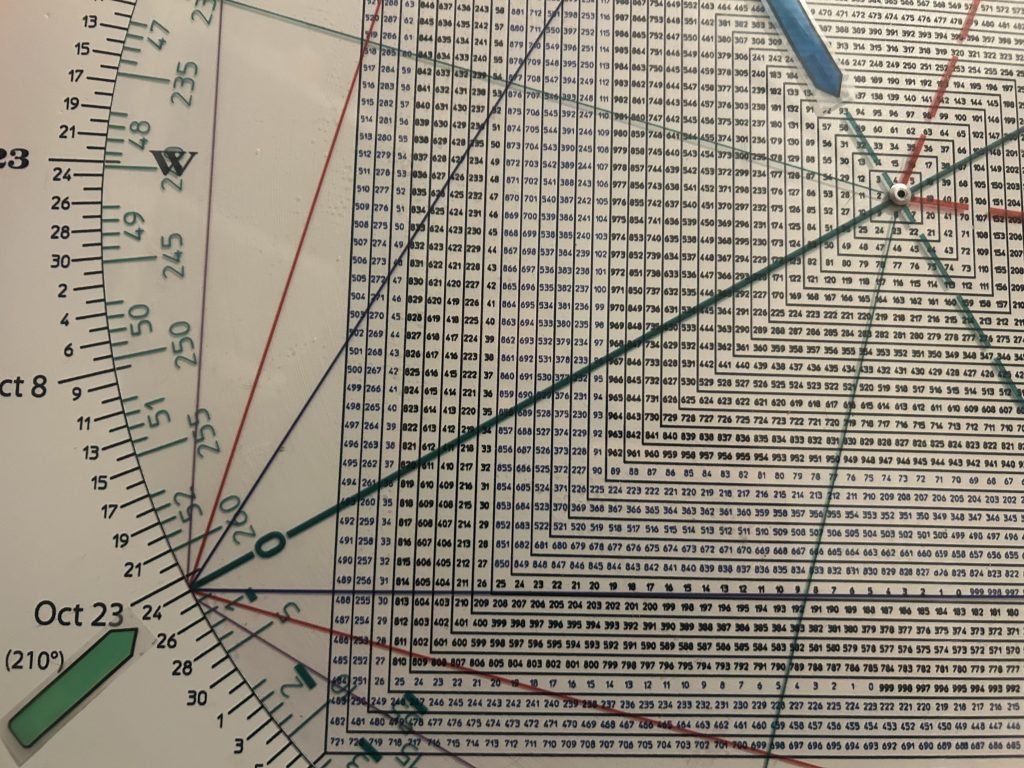
Square of 9 Wheel
Purchase your own Square of 9 Wheel. Shipping to US only. Contact Jeff for shipping outside the US.
CRDO ripped over 10 points on Thursday and pulled back to settle at 132.
Wednesday’s close above the 120 ‘square’ opened the door to 132.
In clearing the August 13 reversal high of 128 yesterday, CRDO triggered a Reversal of a Reversal or what I call a Keyser Soze continuation signal.
A reversal offset often opens the door to a fast move.
In sum, when CRDO reclaimed its 20 DMA in tandem with knifing. through the low of the high bar day,
The threat of a possible Right Shoulder of a Head and Shoulders top was obliterated (Blade Runner buy signal).
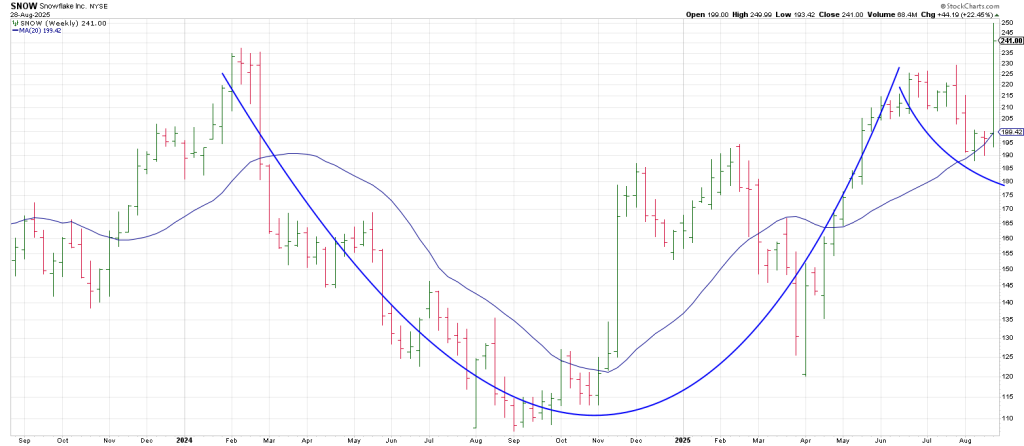
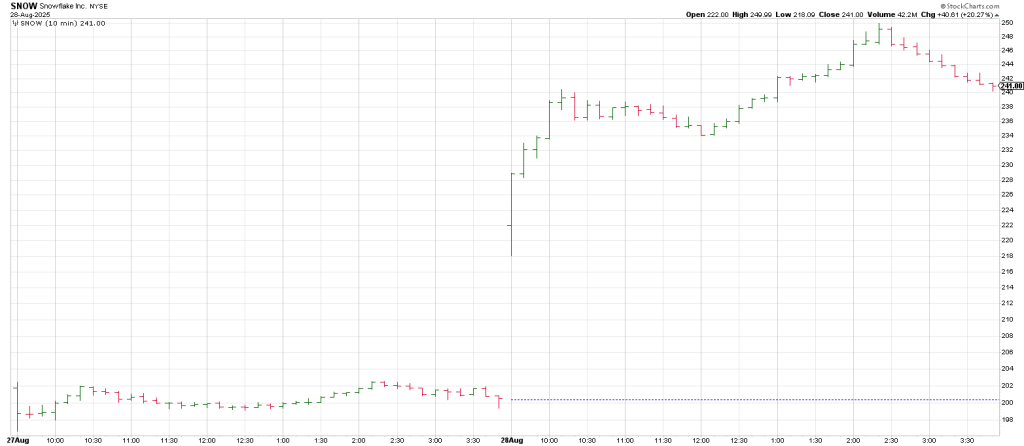
Hit and Run members took SNOW long on Wednesday in front of earnings buying the stock and Friday’s 110 calls.
A weekly SNOW showed an 18 month Cup and Handle.
The Handle was defined by a bullish pullback to its rising 20 WEEK MA that turned the 3 Week Chart down.
The Square of 9 Wheel shows the dynamic risk/reward potential
From the early August 188 low a 360 degree move higher is 247
Following earnings, SNOW blasted to 250 before settling at 241.
In sum, the market has been looking through everything, Deep Seek, Trump attacks on the Fed,
Higher yields overseas, and tariffs.
The stock market has shrugged off a litany of political and economic concerns in its excitement about artificial intelligence and anything related to it.
Mr. Market’s ability to appear invincible has produced extreme euphoria.
We’ve all seen stocks rip on earnings, but the show MDB and SNOW put on this week is pure frenzy.
100 year flood divergences have built up this year.
Two things can happen when you get historic divergences: the market can fall to meet them or the divergences or the divergences can dissolve to meet the market.
That’s what we’ve seen this week.
The T Rex in the ointment is that this strength can suck those who have left the party back in.
This is what happened to the “Bull of Bulls” Will Durant who had been head of GM, in the summer of 1929 after he warned President Hoover of calamity. The Durants worth $90 million in the 1920’s had to sell the art off their walls.
This is what happened to Sir Isaack Newton, called the smartest man on the planet during the South Sea Bubble. He had sold on the way up but got back in and lost everything.
Ironic for the man who discovered the laws of gravity.
This is exemplified by a sharp decline in the NYSE short interest ratio in recent weeks.
This is astonishing because short interest normally rises as stocks advance and declines as stocks fall.
The likely explanation is that speculators who had sold short have reversed their positions during August producing a massive short squeeze.
But markets are not random; they are driven by cycles.
The largest convergence of cycles in the last 100 years is on the horizon.
Something the market will not be able to look through.
We will walk through The Turn over the coming week.
As an example of the Time/Price harmonics we will show are the relationship between the start of the crash on Oct 24th, 1929 and the low in 1932 and how that cycle relates literally to today.
1932 is 93 years from 2025.
On the Sq of 9 Wheel, 93 squares-out with October 24, the day the Great Crash started.
As well, the last bear market low was 16 years ago in 2009.
On the Sq of 9 Wheel 16 squares out with August 28.
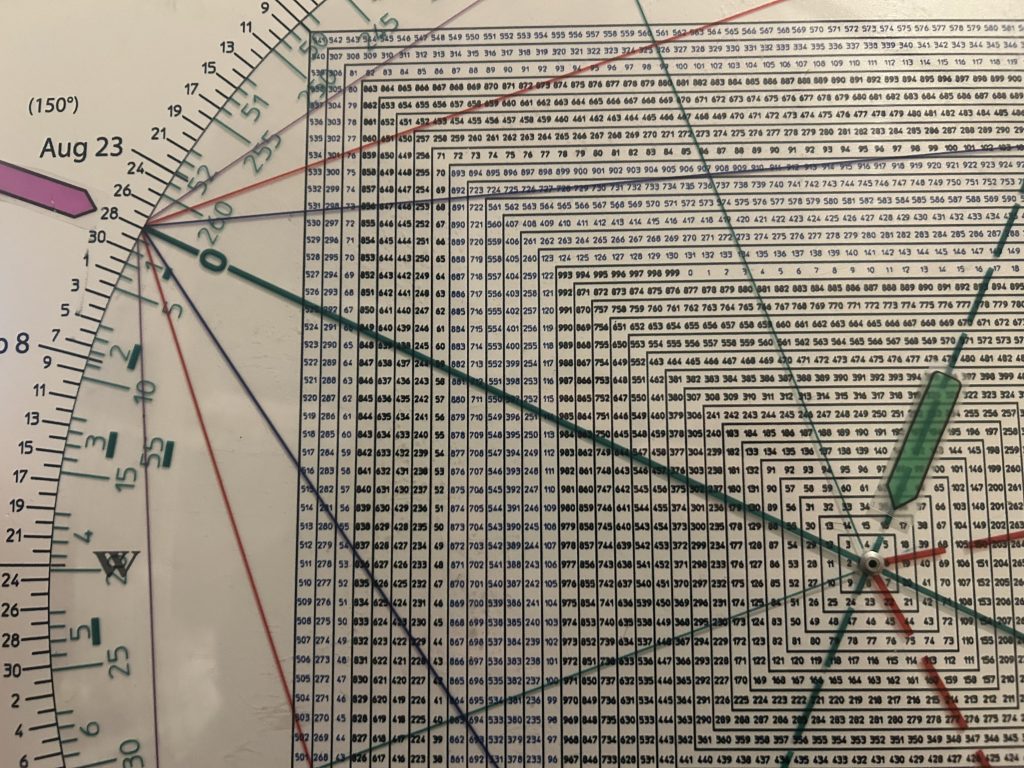
Of course the end of August is the anniversary of three of the biggest tops in history—
1929, 1987 and 2000.
If the market starts to pullback in the first week of September it will be important to see the structure of that decline to see if it leads to a final high in the 4th quarter.
If you have ever been considering getting a Square of 9 Wheel I’m having a Labor Day discount.
Instead of $375 they will go for $300 plus shipping (UPS).
Use coupon code SQUARE75 at checkout. The special will last from today through next Friday.