“Yeah, she’s gonna listen to her heart.” Listen To Her Heart, Tom Petty and the Heartbreakers
Since I wrote the two Hit and Run trading books in the late 1990’s, many traders, especially Hit and Run members have been capitalizing on the same patterns every day.
It’s not surprising.
Legendary trader Jesse Livermore believed human nature never change, which is why the stock market, despite its changing faces and ‘suckers’, remains fundamentally the same.
“Human nature never change. Therefore, the stock market never change. Only the face, the pocket, the suckers, and the manipulators, the wars, the disasters and the technologies change. The market
Itself never changes. How can it? Human nature never change, and human nature runs the market, as they do most other things on this planet.” Jesse Livermore, 1940
“History repeats because of the weakness of human nature. The greed for quick fortunes has cost th public countless millions of dollars. Every experienced stock trader knows that overtrading is his greatest weakness in trading, and that cure is stop loss orders. The weakest point must be overcome an the stop loss order is the cure for overtrading.” WD Gann
I base my trading methods on price patterns and time patterns—cycles.
People think in patterns.
Scientists widely support the idea that humans think in patterns, a fundamental cognitive process known as pattern recognition.
I also key off what is called a Square of 9 Wheel which calculates the synchronicity between time and price called “square-outs”.

Square of 9 Wheel
Purchase your own Square of 9 Wheel. Shipping to US only. Contact Jeff for shipping outside the US.
I don’t use indicators. All indicators are derived from time, price and volume.
They are of second degree magnitude. Why not go right to the horses mouth?
In short, indicators are more descriptive than predictive.
Let’s look at a few recent Hit and Run patterns/setups that were followed by explosive moves.
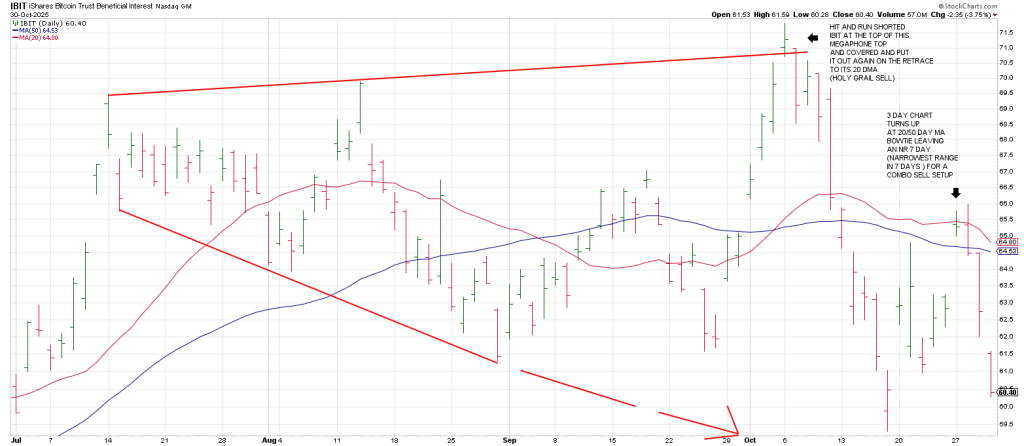
Hit and Run shorted IBIT at the top o this Megaphone Top and covered and put it out again on the retrace to its 20 DMA for a Holy Grail sell signal.
The backtest of the 20 DMA was coincident with a turn up in the 3 Day Chart and an NR 7 Day (the narrowest range in 7 days).
The next day IBIT left an outside down day and the move to test the swing low was on.
Notice that the rally into Oct 27 was an A B C corrective rally.
NBIS left a Combo sell signal on Oct 10: a Gilligan’s Island and a Soup Nazi.
Taken together, the two telegraphed a steep decline that tested the 50 DMA where Hit an Run bought NBIS.
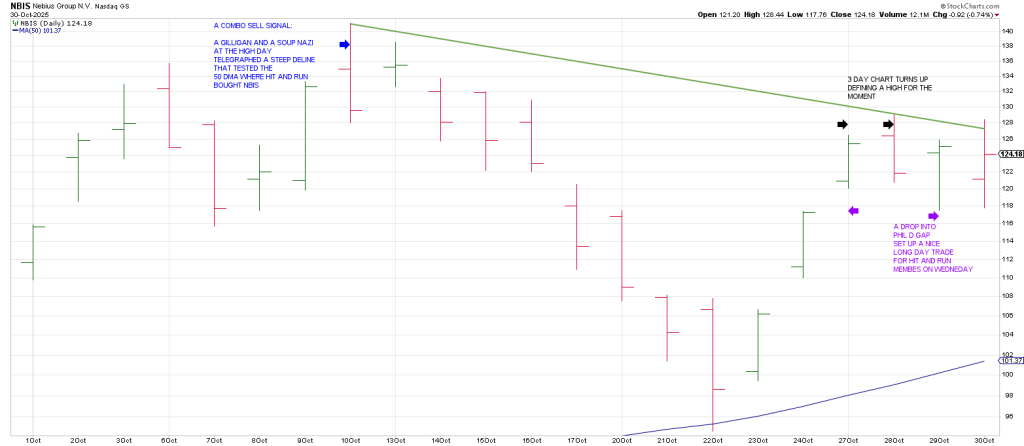
We also capitalize on a Phil D Gap setup on Oct 29th intraday that exploded for 8 points.
LITE triggered a Rule of 4 Breakout (a breakout over triple tops) on a Breakaway Gap on Oct 24.
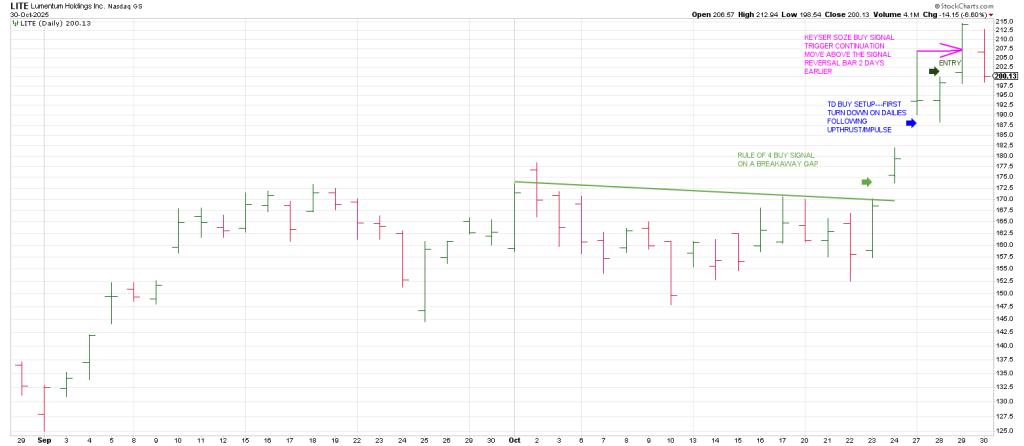
It also left a TD buy setup on Oct 28.
This is the first turn down in the dailies following an impulsive move.
October 29 was Pay Day as LITE triggered another continuation buy signal, a Keyser Soze that triggered on trade above October 27 signal reversal bar.
A Reversal of a Reversal is a powerful setup, long or short.
TEAM is what I call a Bottom Fishing Cup and Handle—a Cup and Handle that plays out near lows.
Note the vicinity of the bottom of the Handle to the 20 DMA on Thursdays (Oct 30) low.
On the run off offers were taken indiscriminately leaving an LROD, Large Range Outside Up Day,
Importantly, the Handle followed an Expansion Pivot large range over the 50 DMA on Oct 21.
After Thursday’s close, TEAM reported. It ran 10 points.
BMN was a Hit and Run short this week.
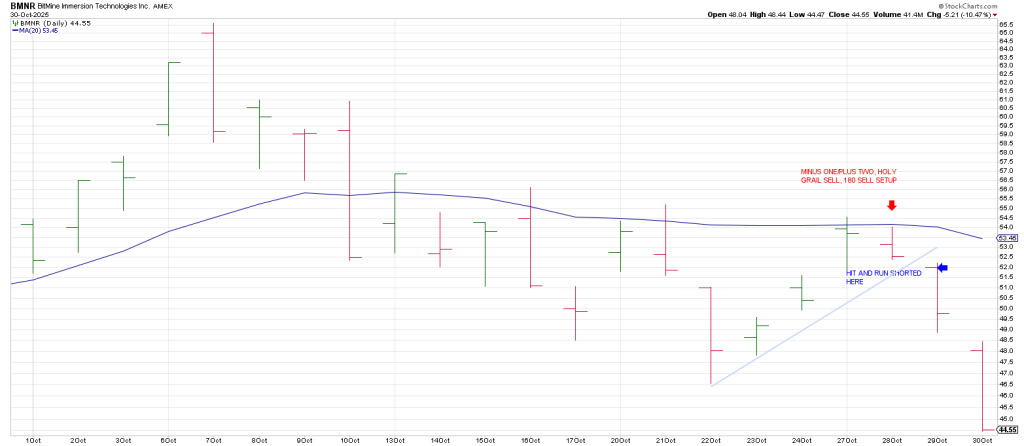
It left a Minus One/Plus Two sell setup on October 27 as well as a Holy Grail (20 DMA backtest).
Wednesday’s gap below the micro trendline buffed out the setup.
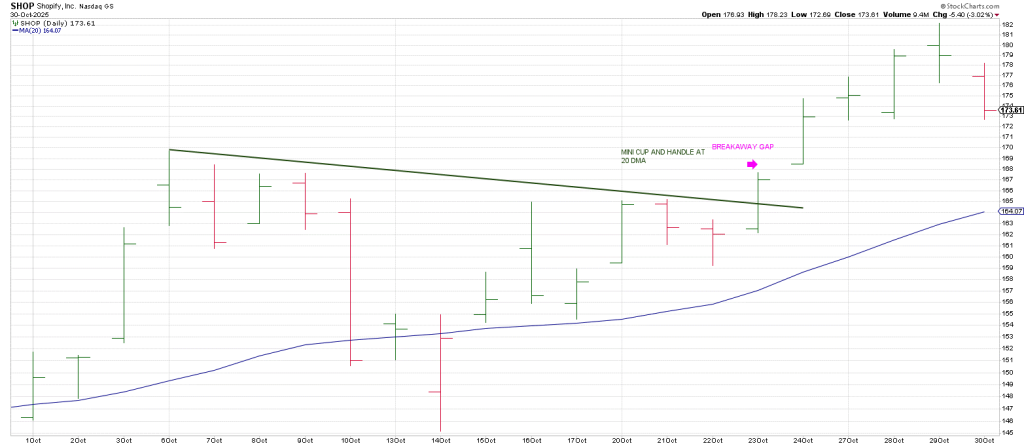
SHOP was a long Hit and Run trade in October triggered by a Rule of 4 setup in combo with a mini Cup an Handle.
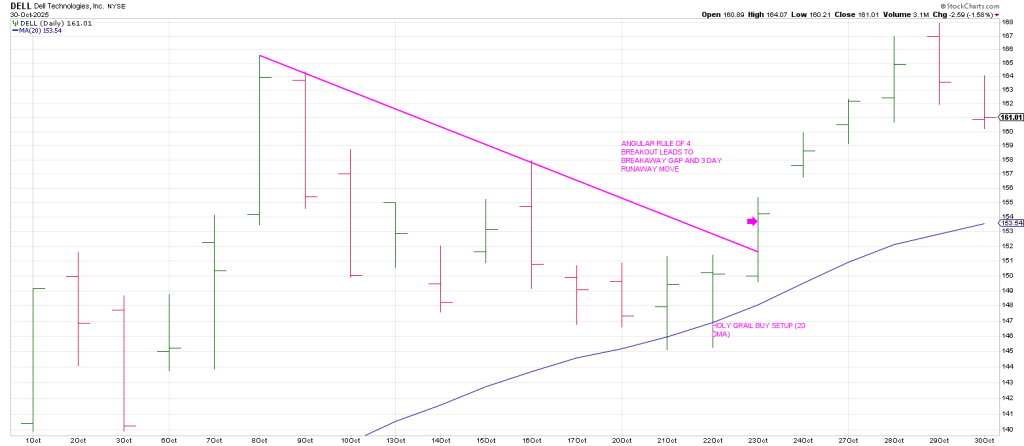
DELL was a long setup for subs triggered by an Angular Rule of 4 setup followed by a Breakaway Gap
That underscored a power move.
GRAL, below, shows two Plus One/Minus Two buy setups.
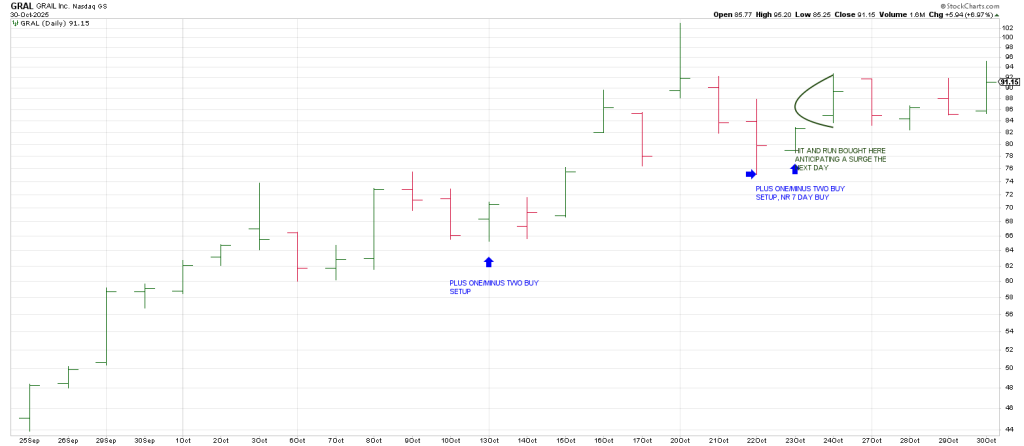
Hit and Run took it long on an NR 7 Day on Oct 23 anticipating a surge the next day—an Overnighter Setup.
The coup de gras…CVNA.
Hit and Run shorted CVNA before it reported on Oct 29.
Why?
It left an Expansion Pivot sell signal (large rang/50MA) on Oct 10.
It backtested its 50 DMA and a Ghost Line, a broken trend line from the past on October 28, turning up its 3 Day Chart in the process.
In a bearish trend this turn up often defines an interim high.
In short, speculation is observation pure and experiential. Thinking isn’t necessary and often just gets us in trouble.
The market.
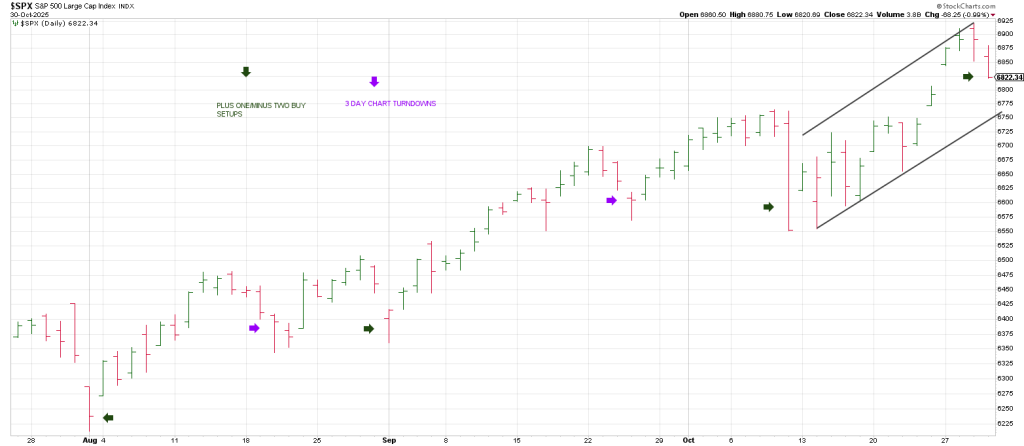
The SPX satisfied a 90 degree decline on Thursday.
In the process it carved out yet another Plus One/Minus Two buy setup.
It is making hay of the setup overnight.