“And we ride down the Kings Highway.” The Kings Highway, Tom Petty
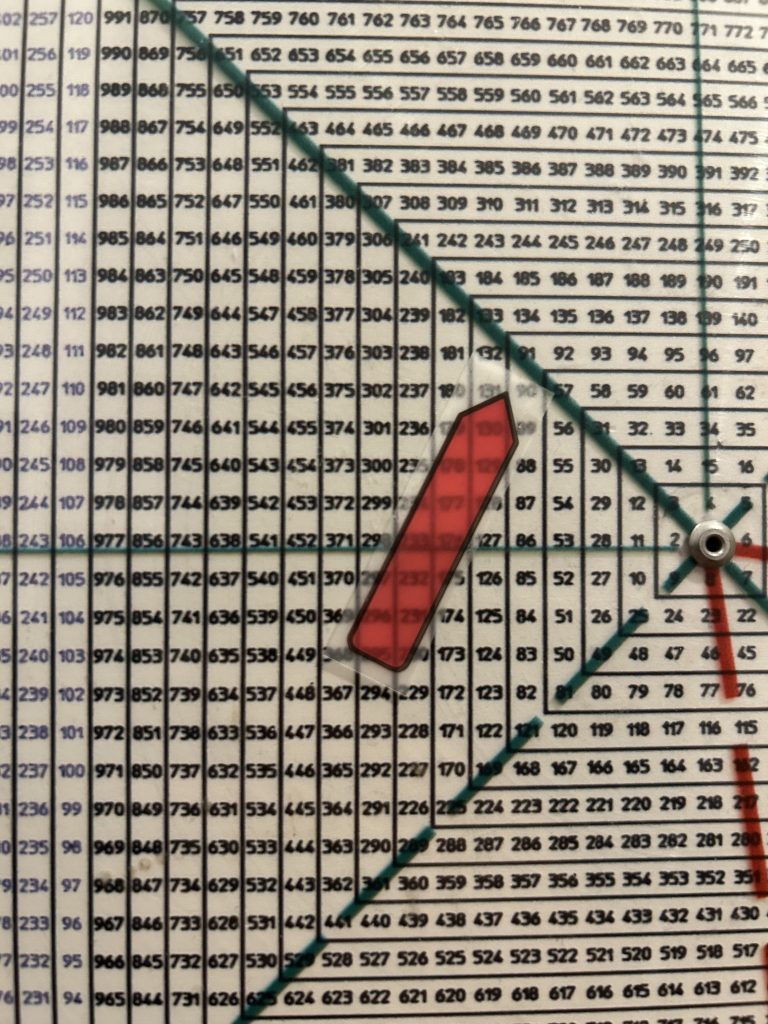
We don’t know what the reaction to NVDA’s earnings will be, but the Square of 9 Wheel does a remarkable job of projecting what levels to expect.
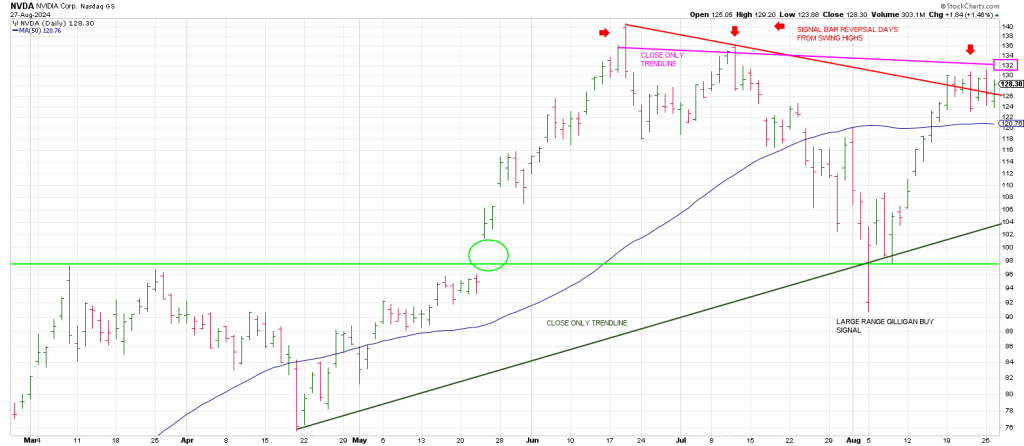
NVDA bottomed at 90.69 on August 5th leaving a large range Gilligan buy signal as it filled the open gap from May 23rd.
A Gilligan’s Island buy signal is a strategy I created to define selling climaxes.
It is a gap down to a new 60 day low with a close at/near session highs.
(opposite for Gilligan sell signals).
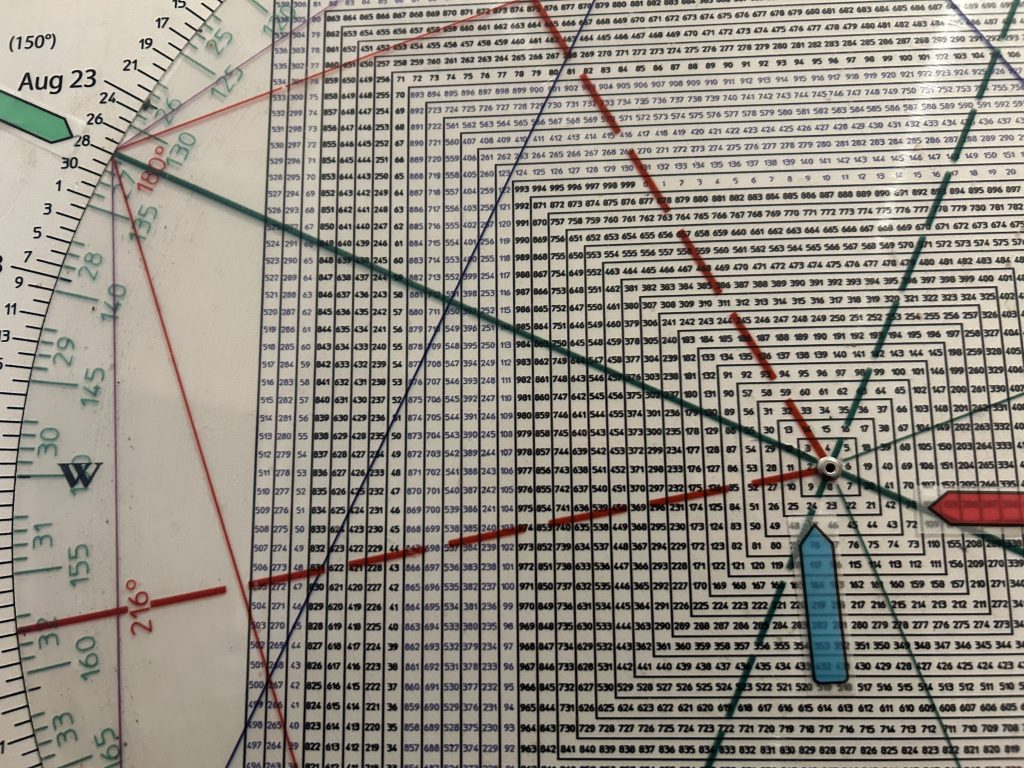
360 degrees up from 90.69 is 132.
Notice the close only trend line from the highs pointing to 132.
NVDA struck a high of 130.75 last Thursday leaving a signal bar reversal day.
It tried to eclipse the 132 region again on Monday making a new high for the move at 131.26 but once again reversed leaving another outside down day.
On Tuesday NVDA carved out the first +1/-2 buy setup since the August 5th low.
This is because the 3 Day Chart is pointing up (+1)and we got 2 consecutive daily lower lows (-2) on Tuesday (intraday lower lows is how you measure this Swing Method…not closes).
If the reaction to earnings is good, and NVDA clears and holds above 132 it opens the door to the next 90 degree decrement higher which is 144.
That is a new record high eclipsing the June 140 high.
What’s interesting is that 145 squares-out with the August 5th low.
Consequently if NVDA drives to the 145 region we will have a Time/Price square-out.
Using the Square of 9 Wheel, Time points to Price, Price points to Time.
Theoretically, clearing 145 opens the door to the next 90 degree decrement higher which is 158.
158 is 540 degrees up from the August 5th low. As such it cubes out the low.
(A cube is a true square with 6 angles/sides of 90 degrees each…90 X 6 = 540).
If a negative reaction plays out, 180 degrees down from the previous 140.76 record high is 117.50.
That ties to the 20 day moving average.
Below that opens the door to 106.50
Notice the close only trend line from the April low at 104.
A full 360 degrees down from the record high is 97.50.
Notice the pivot highs and lows at 97.50 since March.
The low close for August is 98.91 which ties closely to 97.50.
These are the upside and downside pivots given by the Square of 9 Wheel.

Square of 9 Wheel
Purchase your own Square of 9 Wheel. Shipping to US only. Contact Jeff for shipping outside the US.
Tonight’s earning’s in NVDA are a bigger deal than most may realize.
The October 2022 low was 10.80.
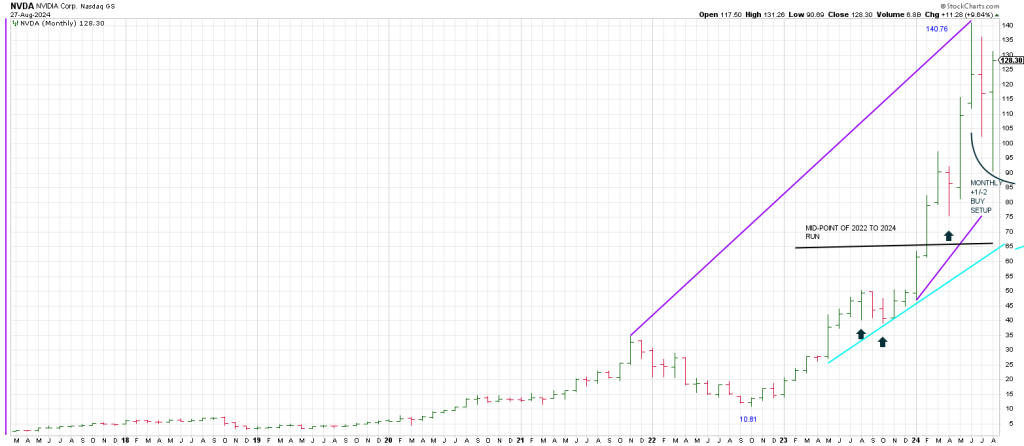
Since October 2022 NVDA turned its Monthly Swing Chart down 3 times going into the June 2024 high.
Subsequently NVDA carved out 2 consecutive monthly lower lows in August satisfying a monthly Plus One/Minus Two buy setup.
NVDA explode back towards its all time highs.
If it closes above 123.54 in August it will be a record monthly closing high.
A weekly close above 131.88 will register a record weekly closing high.
Remember 132 is 360 degrees up from the August 5th low.
Said another way, NVDA exploded a full 360 degrees in 3 weeks.
As shown on the Sq of 9 below, 10.80 (the Oct 2022 low) points to September 28th.
It also squares out with 138.50 which ties to the record high.
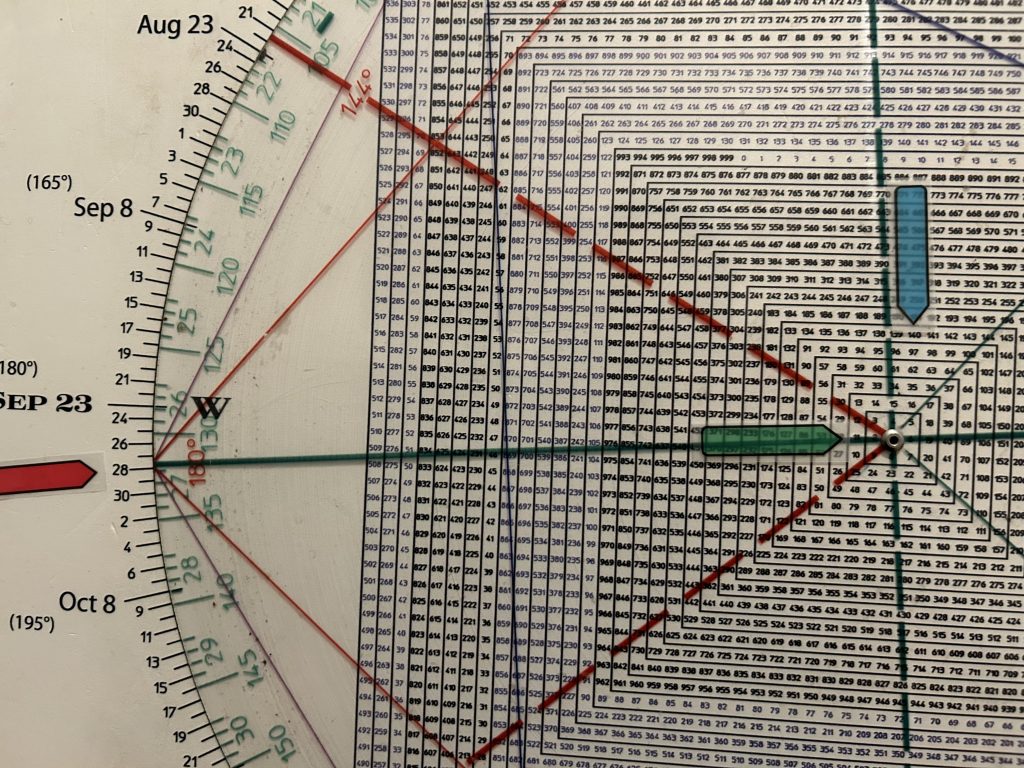
If the reaction to earnings sees a selloff this Time/Price trifecta may be telegraphing a major top in NVDA and by extension the market in keeping with The Cycle we’ve been looking at to exert its influence in the 3rd quarter of 2024.
In sum, NVDA is 6.1% of the S&P 500. It is a bell weather for the entire U.S. stock market.
Here at the end of August we at the anniversary of the Secondary Top from the year 2000.
That was 24 years ago.
That top was the anniversary of the late August/early September top in 1929….71 years earlier.
From 2000 to 2002 the NAZ mirrored the DJIA bear from 1929 to 1932.
This 24 and 71 year ‘harmonic’ has an interesting relationship with today:
They square-out with August 28th, the day the world waits for the King to report after the bell.
The question is whether the King has an encore or has left the building?
Counting from the July SPX record high, August 28 is an extremely important pivot in the annals of stock market history off major highs that produced Secondary Highs.