“I tear it down, I tear it down, and then it’s born again
How long, how long will I slide?” Otherside, Red Hot Chili Peppers
“There are two types of people: those who try to win and those who try to win arguments. They are never the same.” Nicholas Taleb.
Volume precedes price.
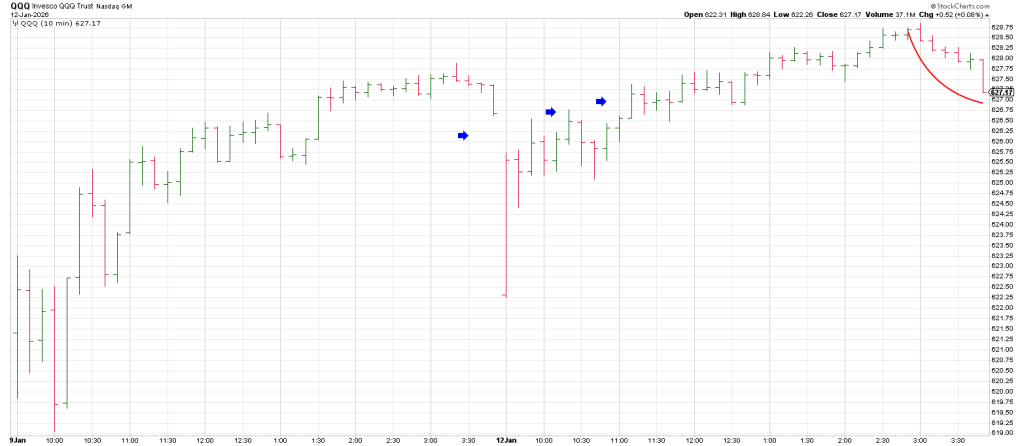
Volatility rose Monday —best reflected in the Q’s that gapped down 4.50 points striking a low on the open and rallying into the last hour.
I guess you could say Monday’s upside reversal was an Unintended Powell Pivot—at least not by the Chairman himself.
The Algomatics flipped the switch, likely orchestrated from well before the open.
What did they know? That any legalities against Powell would never hit the courts until well after his term ends in May.
It was drama.
That said trade back below Monday’s low is not what traders are expecting after yesterday’s reversal.
If it plays out anytime this week, it opens the down door.
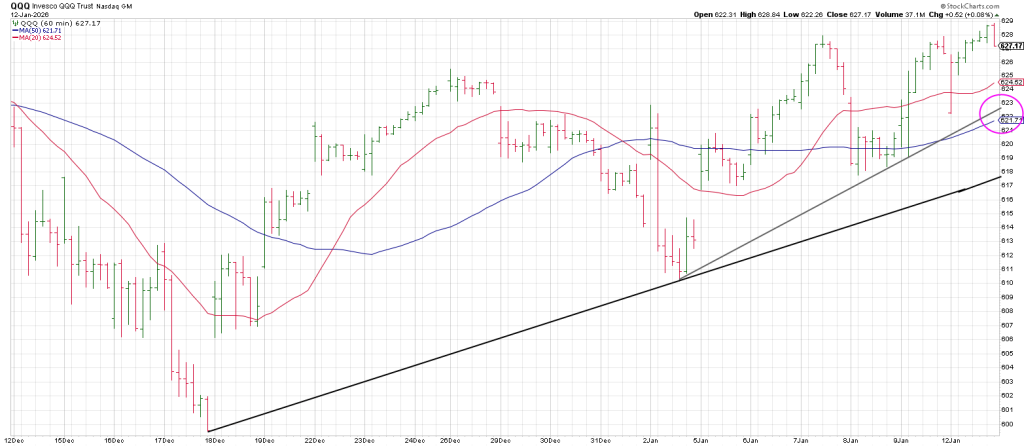
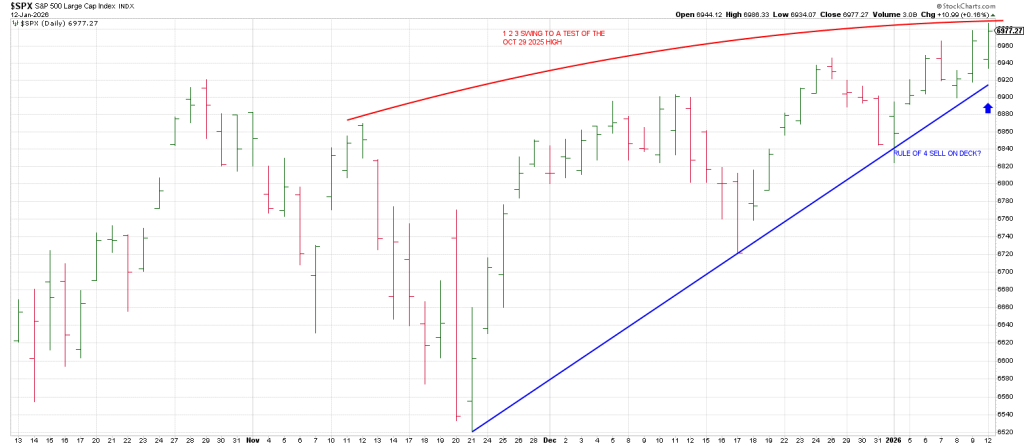
Why that’s important is because there is precious little room before a 3 point Bottoms Line from November is violated triggering a Rule of 4 Sell.
Currently a Rule of 4 Sell would be triggered at 616.80 QQQ in tandem with breakage below the 50 dma. That will give it some punch if it occurs.
Short term cycles suggest that is a strong likelihood.
On Monday, the Q’s triggered an up ORB (Opening Range Breakout), backed and filled and then triggered a Jump the Creek continuation buy signal by pushing through Monday morning’s open gap…perpetuating a push higher—that is until the last hour.
An hourly QQQ shows they got hammered in the last hour tracing out an outside down hour.
Whether that is a precursor for a Turnaround Tuesday remains to be seen.
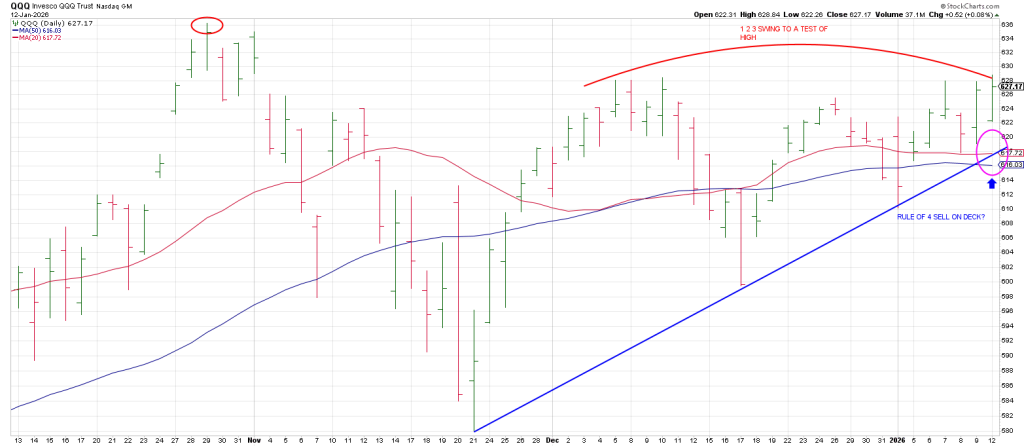
Underscoring the potential for volatility to pick up—on the downside most likely —is that the Q’s show a 1 2 3 Swing to a Test of the October 29th high.
This is an important pattern. It is a fractal of the weeklies that defined the Secondary Top in the SPX in early September 2000.
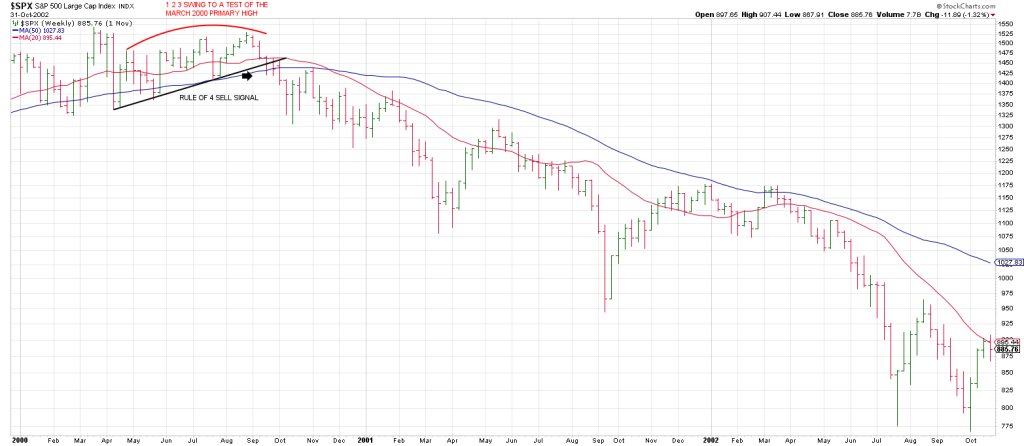
Following the Primary high in March 2000 on the SPX, the market broke then rallied back making the aforesaid Secondary High.
From September 2000 the market slid two years into an early October 2022 low.
I think we are making a Secondary high to the October 29th high on the dailies currently, versus the weeklies in 2000.
Below is a daily SPX showing their potential 1 2 3 Swing to a Test of their Primary October 29 high.
We have many near term market cycles on the table.
1) the SPX made a Primary High on January 23/24, 2025. The index carved out a Secondary High on February 19th. So the 1 year cycle looms.
Notice that the Feb 19 Secondary high was a nominal new high and also showed a mini version of this 3 Swings to a Test pattern. That pattern/cycle perpetuated a 1312 point SPX drop in just under SEVEN weeks, an important Gann Panic Cycle.
2) We are 9 months or 270 days/degrees from the significant April 7, 2025 low.
3) January 29th is 90 days/degrees from the October 29 important high.
4 Feb 20 is 90 days/degrees from the February 2025 top.
Pattern Recognition
Hit and Run makes its plays putting the pieces together of Time, Price and Pattern.
Let’s zero in on ORCL.
Several names that have been beaten down came to life on Monday
ORCL rallied sharply on Friday, on an expansion of volume and followed through on Monday.
Hit and Run bought ORCL at 198.35 on Monday trimming 1/3 at 206.50.
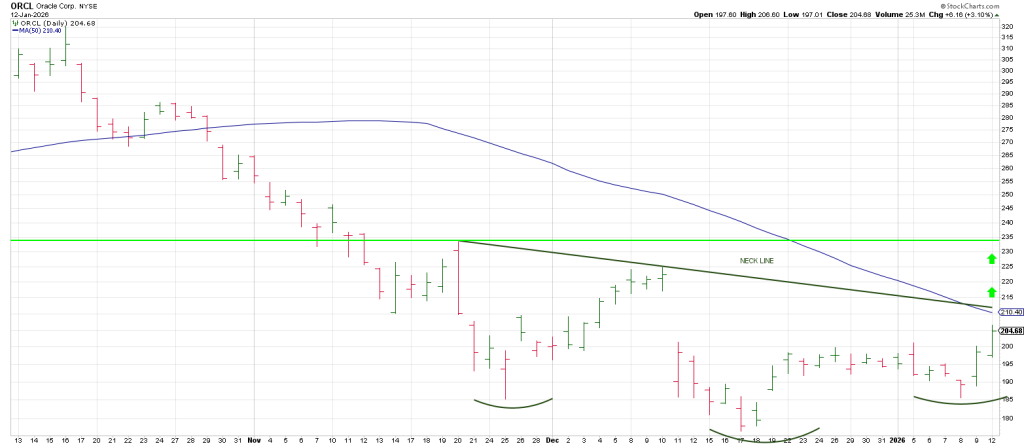
ORCL is sporting an inverse Head and Shoulders. The Neckline is declining trend line from its November high and will be triggered on trade through 212 which ties to the 50 day moving average.
The Head and Shoulder projection is 234.
Interestingly taking the 177 December 17 low, a 360 degree advance as measured on the Square of 9 Wheel also projects to precisely 234.
When I see two different technical coming together, in my experience the odds of the projection are enhanced.
Notice also that 234 ties to the spike high reversal on November 20.
Checking a weekly ORCL shows a declining Tops Line from its September 10 top comes in at this 234 region in sync with its 20 week moving average which is flattening out.
Notably the December 17 low ties roughly to 90 days/degrees from the September 10th high, backstopping the idea that A TURN is in.
Checking the Square of 9 Wheel From the Sept 345 high we see that 345
points to January 27.
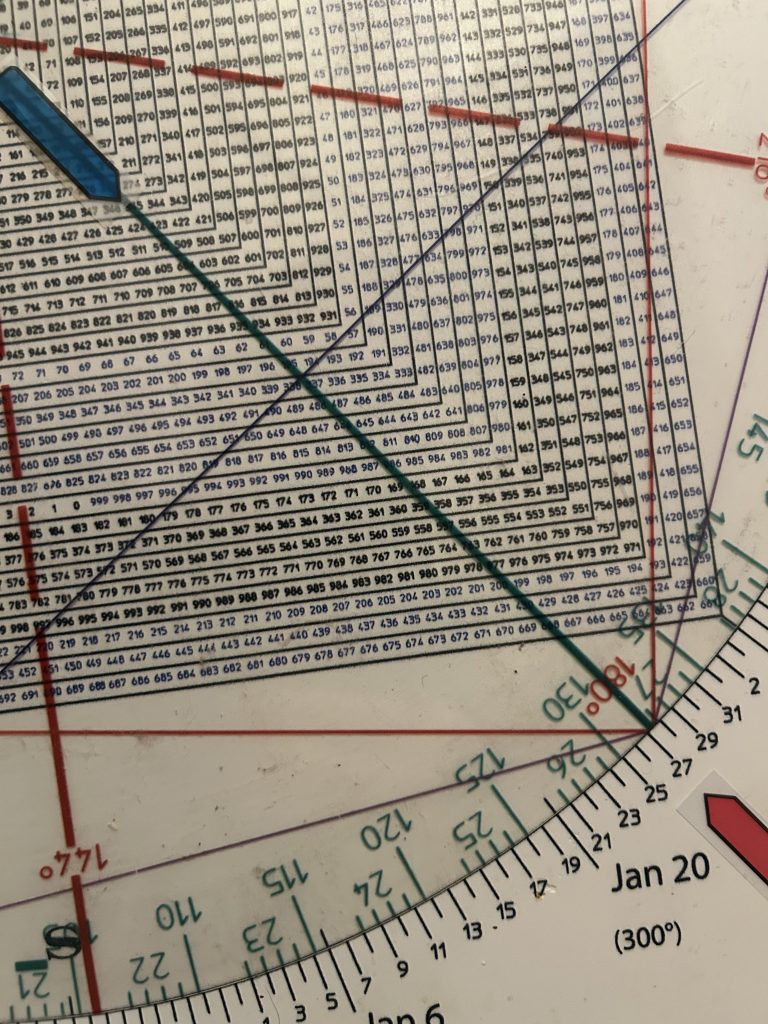
In keeping with W.D. Gann’s Law of Vibration we have a potential vibration from the all-time high that ties to January 27.
My take away is that ORCL likely has blue sky into late January.
January 27 squares 227, just below the 234 idealized ‘target”.
The likelihood is that ORCL will push to the 230 region.
It should be a buy on pullbacks until that region is satisfied.
Notably, ORCL has not even turned its 3 Day Chart up off its December low with 3 consecutive higher intraday highs.
With Monday’s rally it shows 2 strong consecutive higher daily highs.
Trade above Monday’s high will turn its 3 Day Chart up for the first time since November 20th.
That turn up defined a significant turn down.
The tell is when the 3 Day Chart turns up and defines a high within the context of a persistent down trend, the item is going lower.
The behavior today when ORCL likely turns its 3 Day Chart up will be a strong tell.
While we may see a knee-jerk reaction, especially if ORCL pushes to the 50 day ma today.
Bottom line an extension following a turn up in the 3 Day Chart opens the door higher.
One of the greatest problems for traders, whether they are short term traders, swing traders or position traders is how to define the major trend, the intermediate term trend and the minor trend.
Even if you are a short-term trader the nature and structure of the larger trends will affect your position.
Multiple time frame analysis is the secret to successful speculation because all trading is contextual.
That means short term trades don’t exist in isolation, they are in the context of the intermediate and major trends.
Most traders have a hard time defining the trend and hence get caught buying pullbacks after a major high and shorting Snapbacks after a major low.
The analysis of ORCL above underpins the why and when of looking for a Turn and switching to the “other side”…in this case the buy side.
Below is a Weekly Chart of ORCL from its high showing how the 3 Week Chart which is the heart and soul of my swing method sent alarm bells in October 2025 that the decline was just beginning.
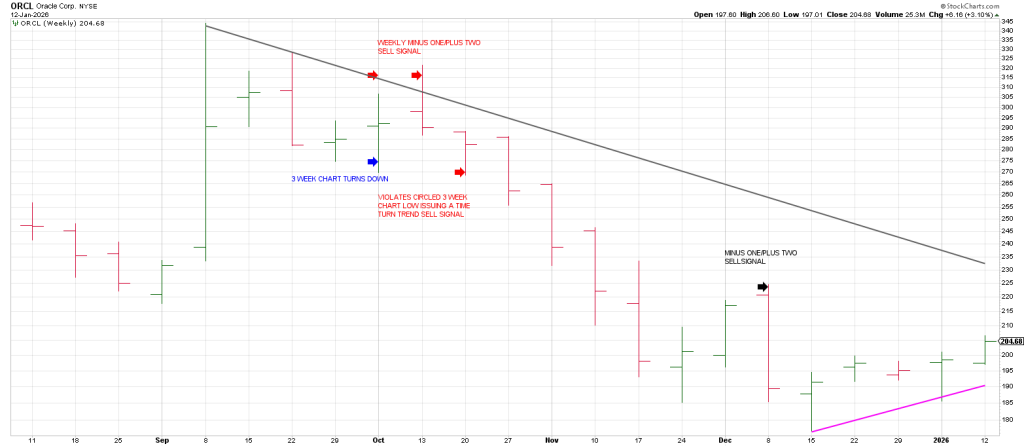
ORCL turned its 3 Week Chart down on the week of October 6, from there it rallied scoring two consecutive weekly higher highs.
This is my Minus One/Plus Two sell signal.
3 consecutive weekly lower lows is the Minus One.
Following a Weely Minus One any time the 3 Week Chart is pointing down and you get 2 consecutive weekly higher highs produces a Plus Two satisfying a Weekly Minus One/Plus Two sell signal.
How well did the signal work?
When ORCL violated the circled 3 Week Chart low at 271 it dropped 94 points in SEVEN weeks.
Amazing.
When ORCL took out the “circled” 3 Week Chart low of 271 it issued a Time Turn Trend sell signal. In other words trading quickly back through the circled 3 Week Chart low and continuing lower was confirmation of a Secondary High…the high on the week of October 13.
Let’s look at GDXJ.
From a Weekly Signal Reversal bar on the week of October 12, GDXJ turned its 3 Week Chart down in 3 weeks as soon as it could have into the week of November 3. GDXJ had pulled back from 112.45 to a low of 87.35.
The turn down put in a low for a stunning rally to 128 on Monday.
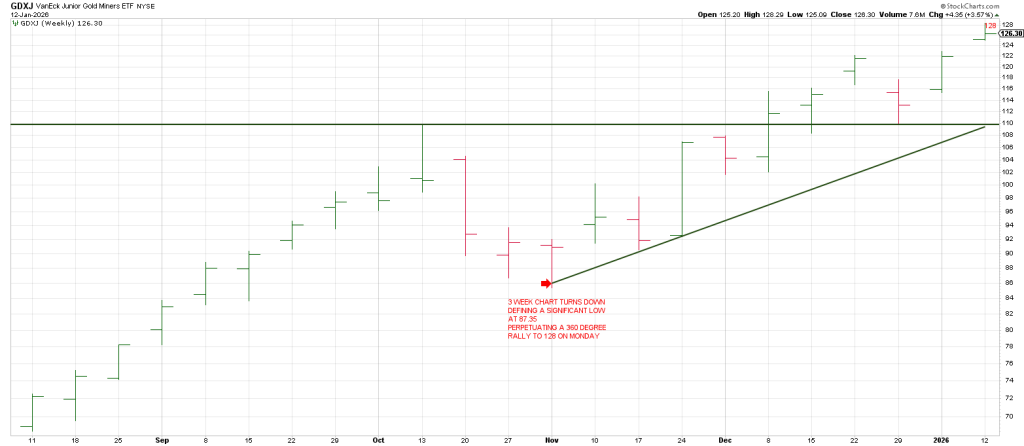
From 87.25 to 128 is 360 degrees, a natural spot to expect at least a pullback. .especially as 5 minor waves up can be counted.
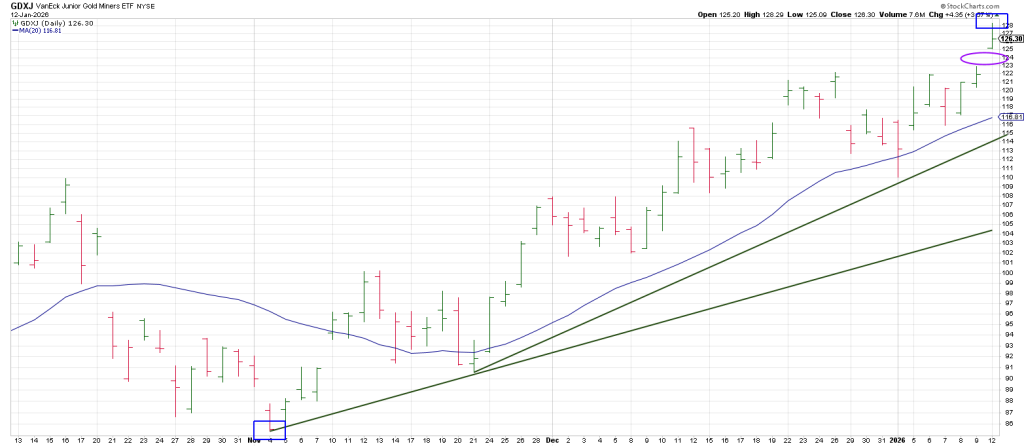
GDXJ tailed off on Monday leaving the specter of a downside gap on the table.
A gap below Monday’s gap open low of 125.09 that sticks puts the prospect of a Island Top of some degree on the table.
90 degrees down from 128 is 117 that ties to the 20 day moving average that has acted as support since the November 21 low.
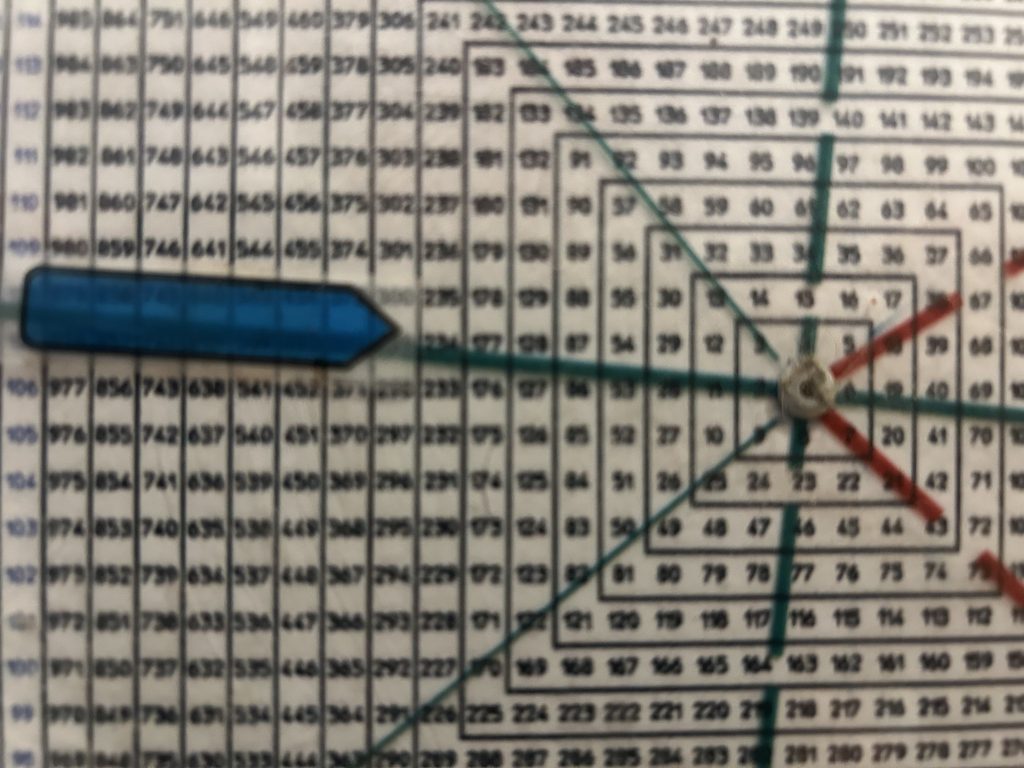
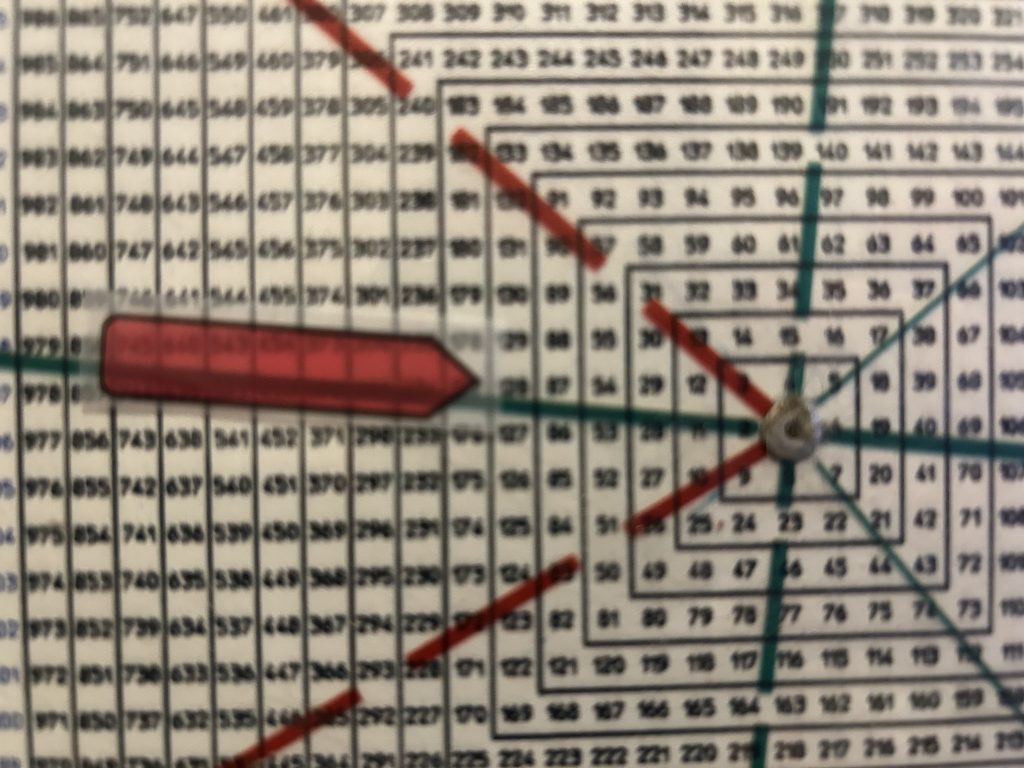
We use the amazing Square of 9 Time/Price Calculator to help determine where when trend turns and time is up. It is the only trading tool that integrates Time and Price.
As Paul Tudor Jones states, “I believe the very best money is made at the market turns. Everyone says you get killed trying to pick tops and bottoms and you make all your money by playing the trend in the middle. Well for twelve years I have been missing the meat in the middle but I have made a lot of money at tops and bottoms.”
The Square of 9 has been an integral part of our catching major turns in the last 25 years.
These include the March 2000 top. The September 2000 Secondary top, the October 2002 bear low.
The October 2007 bull top.
The pre-covid crash high.
The exact day of the Covid Crash low.
The January 2022 top.
The Feb 2025 peak.
Go to cooperhitandruntrading.com to grab a free ebook on how the Square of 9 works.

Square of 9 Wheel
Purchase your own Square of 9 Wheel. Shipping to US only. Contact Jeff for shipping outside the US.