“Mathematics is the only exact science. All power under heaven and on earth is given to the man who masters the simple science of mathematics.” WD Gann
“Square one, my slate is clear.” Square One, Tom Petty
Before we take a look at individual stocks let’s look at GLD.
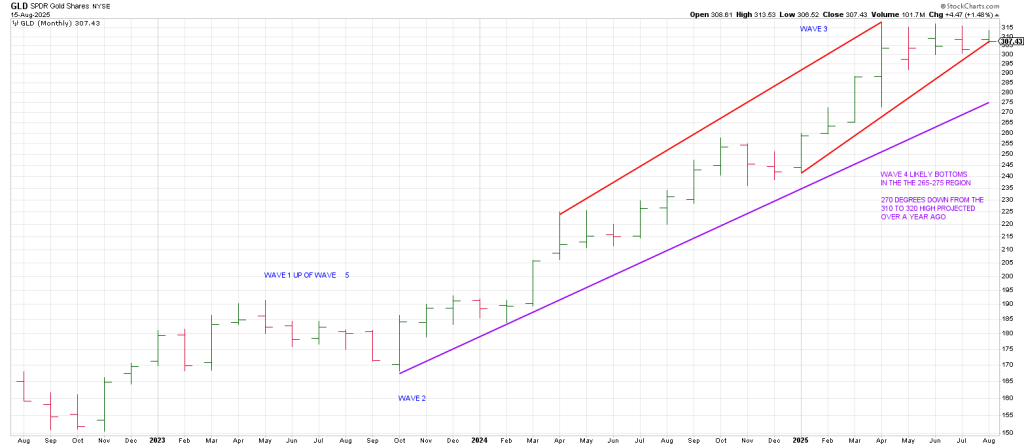
A monthly GLD shows the start of a 5th wave rally at the end of 2023.
That was when an outside up month telegraphed a breakout of a 3 year plus trading range was on the table.
A massive Rule of 4 Buy signal (a breakout over a triple top) triggered in March 2024.
September will be 540 degrees or a key 18 months from that breakout.
So September cubes-out the breakout as 540 degrees/days is a cube or a true square-out.
Amazingly 540 degrees (18 months) from the October 2023 outside up month, that lit the fuse for the rally was April 2025.
April 2025 was the large range Buying Climax and high for the move.
That monthly bar was the largest in years with a range from a low of 272 to the 317 high.
In fact the week of April 21 marked a large range reversal week.
So you can see the synergy with this 540 degree time-frame.
I have probably read everything Gann has written.
Nowhere do I find the mention of a cube.
He mentions squares and square-outs all over the place.
No cubes.
It’s not unintentional.
Gann was a mathematician extraordinaire.
If Gann didn’t mention it, it is because he didn’t want to give it away.
In researching my 2004 DVD course, Unlocking the Profits of the New Swing Chart Method, that tracks every major swing in the SPX from 1941 to 2004, I was amazed to see how many price swings and TIME swings were 540 degrees.
I didn’t know why. Then it hit me.
540 degrees is a cube, a true square.
Returning to GLD…with two weeks to go this August, it sets up to be an NR 7 month, the narrowest range in 7 months.
This contraction in volatility will see an expansion in volatility next month.
IF there is a pop higher, the likelihood is it will be a fake-out before a Wave 4 decline sets in.
September was a major top in 2011 with a false new high before leaving monthly Train Tracks.
That was 14 years ago.
7 years from 2011 is 2018.
GLD struck a low in August/September 2018 that preceded a major advance into August 2020.
7 years from August/September 2018 is August/September 2025.
August/September has been a major turning point for gold.
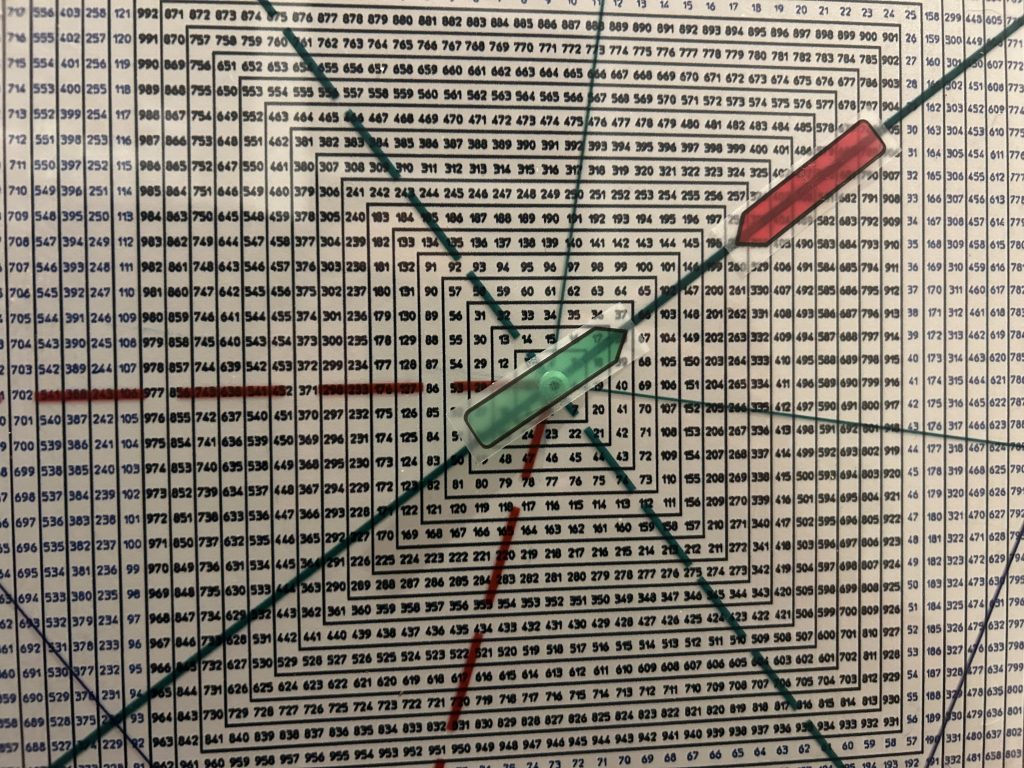
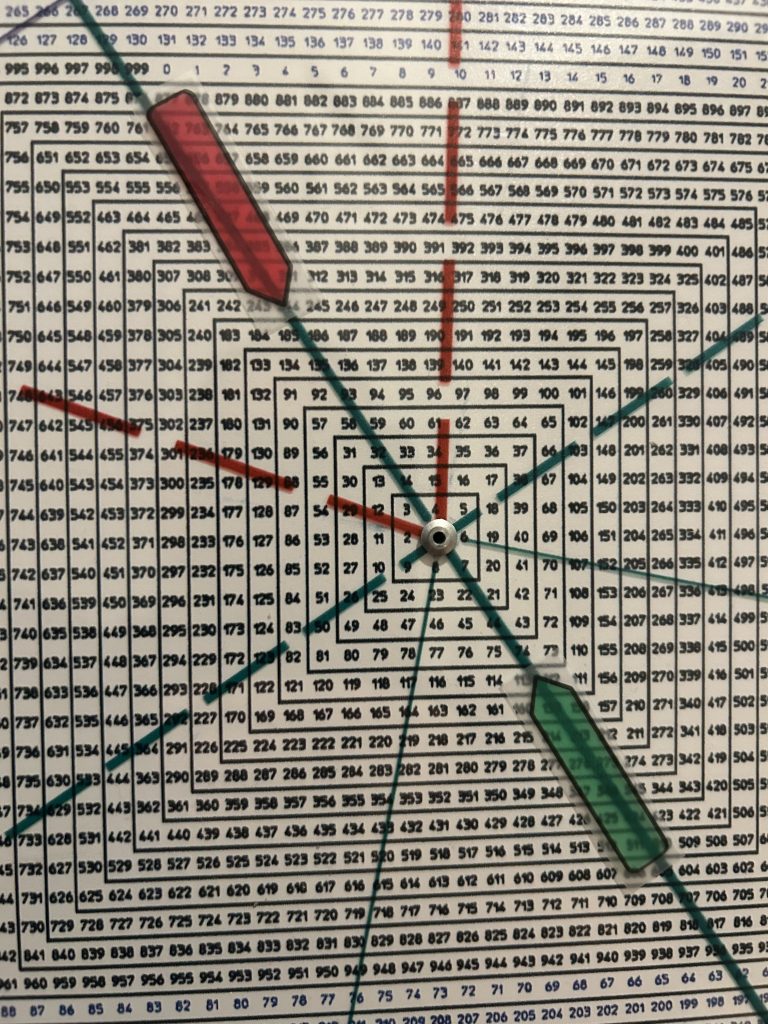
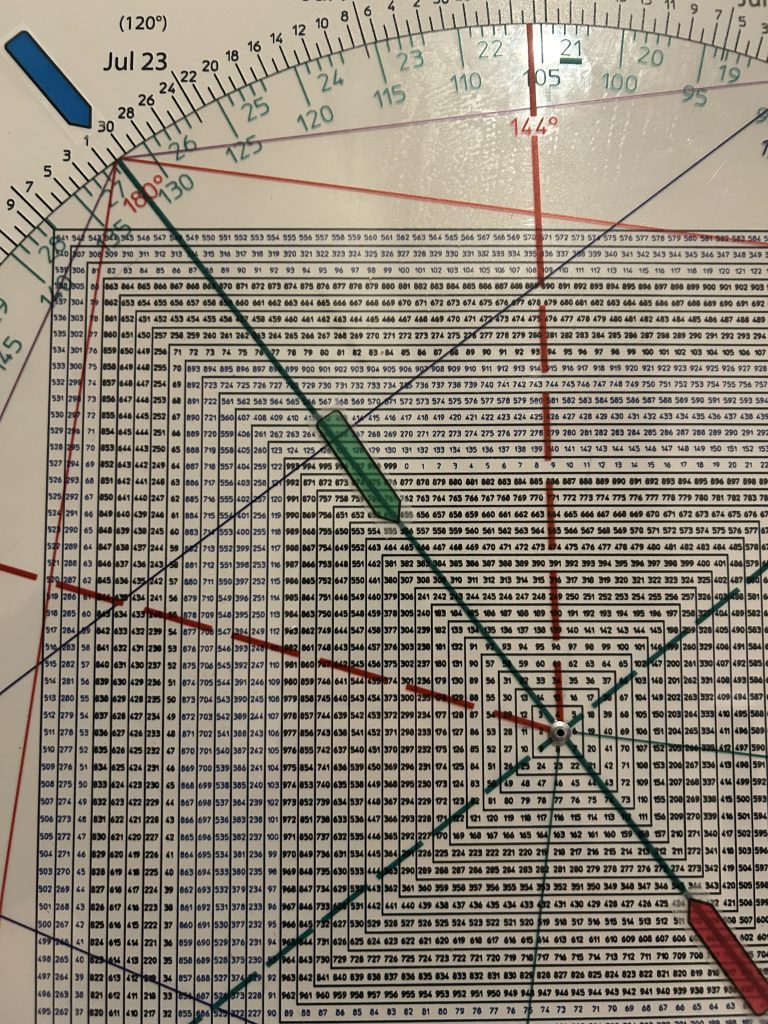
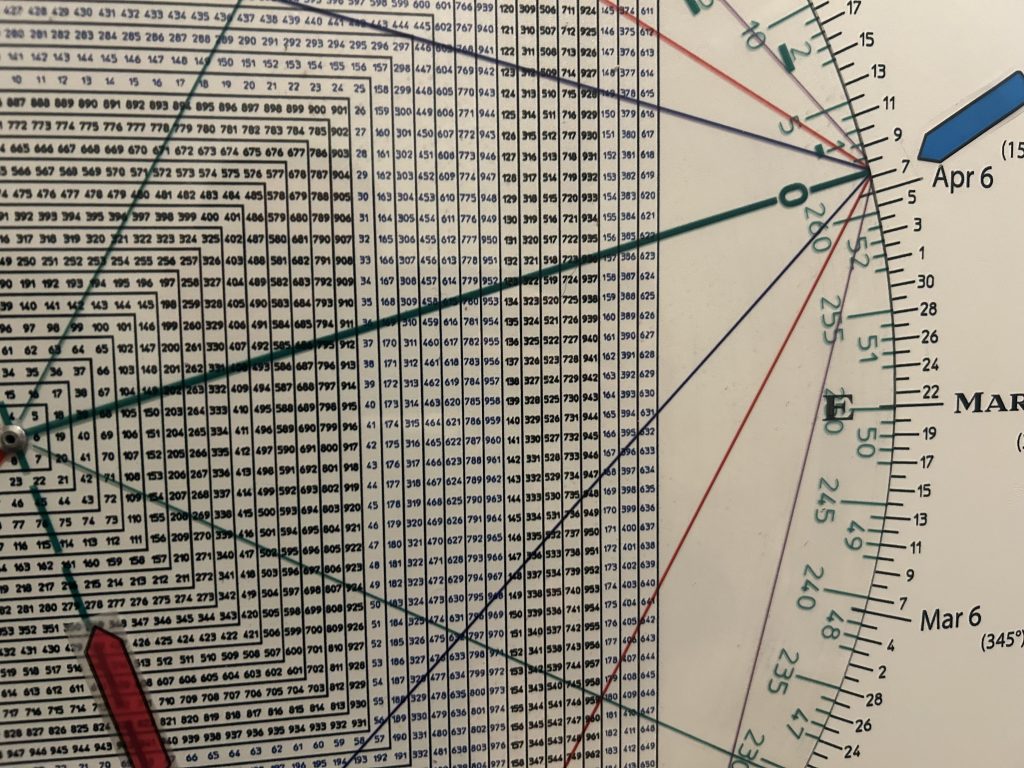
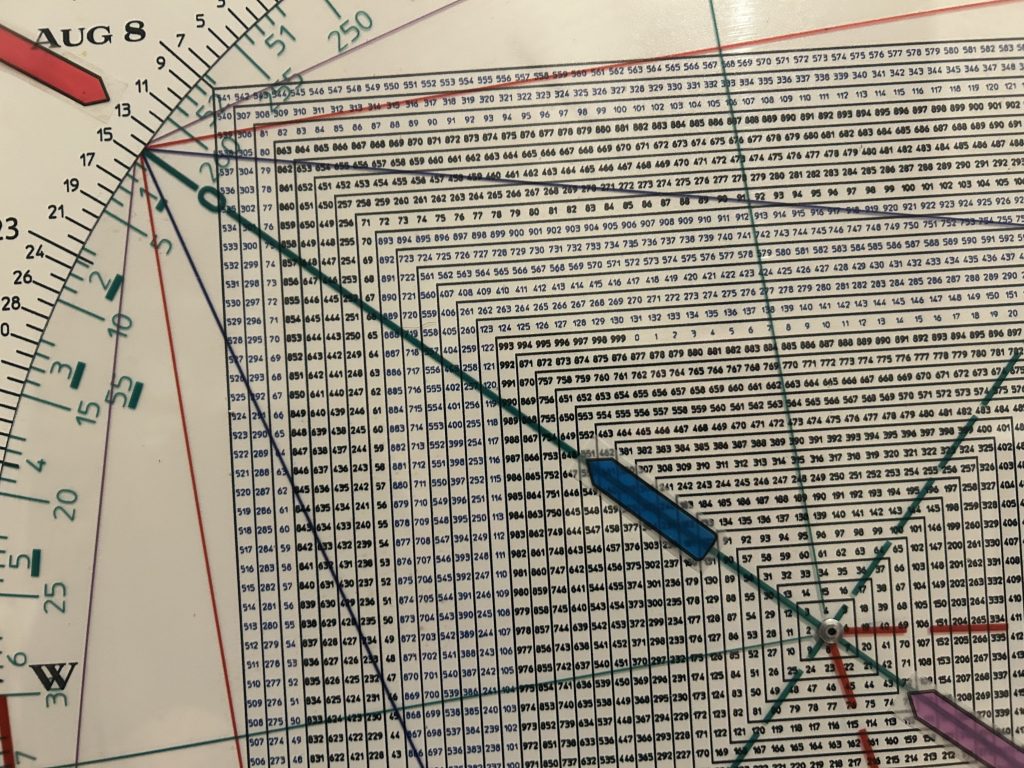
Let’s take a look at some key stocks to see how the Square of 9 Wheel of Time & Price helped call the change in trend
PLTR bottomed at 66 in early April embarking on a stunning advance.
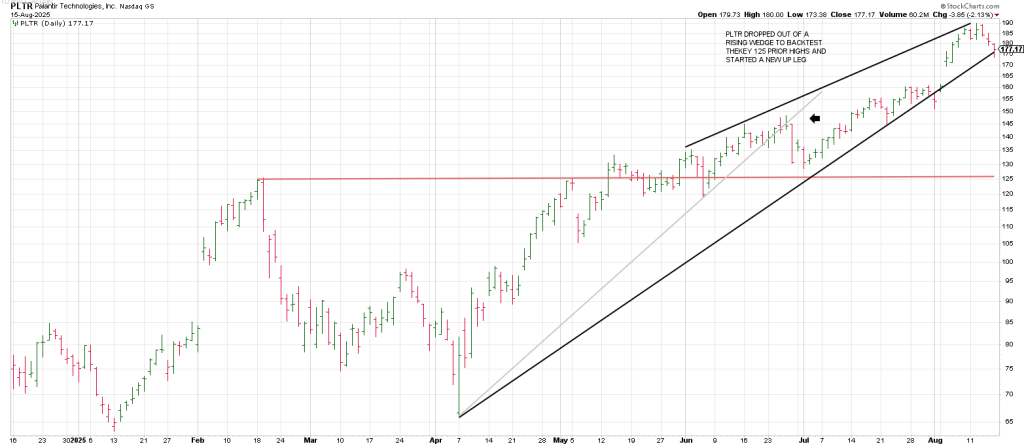
Remarkably, PLTR has not turned its 3 Day Chart down during the entire advance.
The 3 Day Chart turns down with 3 CONSECUTIVE lower lows (not lower closes—lower lows).
PLTR has two consecutive lower daily lows going into today.
It has a chance to turn its 3 Day Chart down Monday on trade below 173.38.
Interestingly PLTR closed on a trend line from the April low. So, should the 3 Day Chart turn down the ensuing price action will be important.
Notice while PLTR shows 3 consecutive lower daily closes it does not show 3 consecutive lower daily lows.
Markets play out in “three’s”. 3 is the heart beat of the market.
PLTR bottomed at 66 on April 4, 2025..
3 price cycles of 360 degrees up is 199.
The likelihood is PLTR has a date with 199 after this current pullback.
That said 188 squares-out with April 7th, the low and the high close is 187.
When using the Square of 9 Time/Price Calculator it is important to measure from CLOSES as well as intraday highs and lows…especially when the low or high is a wide range bar.
For example the low close on PLTR in April was 74.
185 is straight across and opposite 74.
It is 900 degrees (2 ½ price revs of 360 degrees up from 74).
MSFT bottomed at 345 on April 7, 2025.
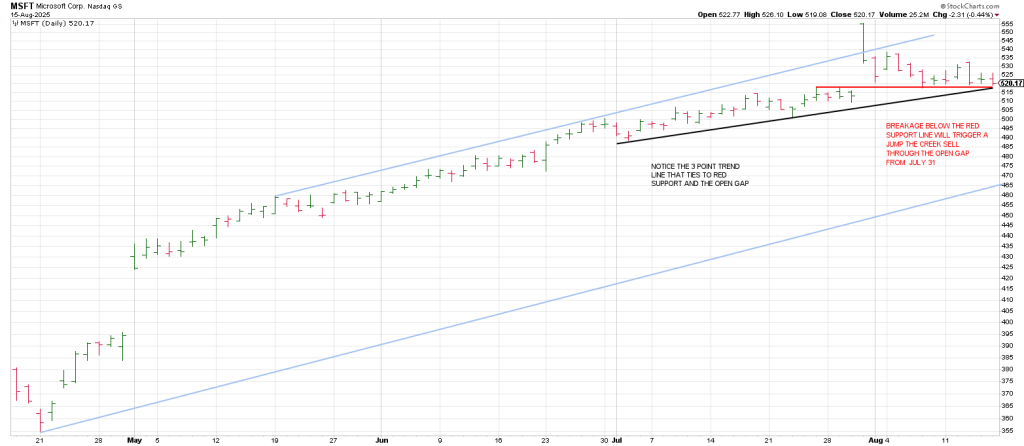
Straight across and opposite 345 is 555.
555 is 900 degrees up from the 345 low.
Amazingly MSFT left a large range reversal bar from a high of 555 on July 31st.
It was left a Gilligan sell signal (a gap up to a new 60 day high with a close at/near session lows.
As well the July 31 reversal was a Throw-over of trend channel.
Notice the bottom of the trend channel ties to 465 region over coming weeks.
Just as amazingly, July 31 aligns with 555 and is opposite 345.
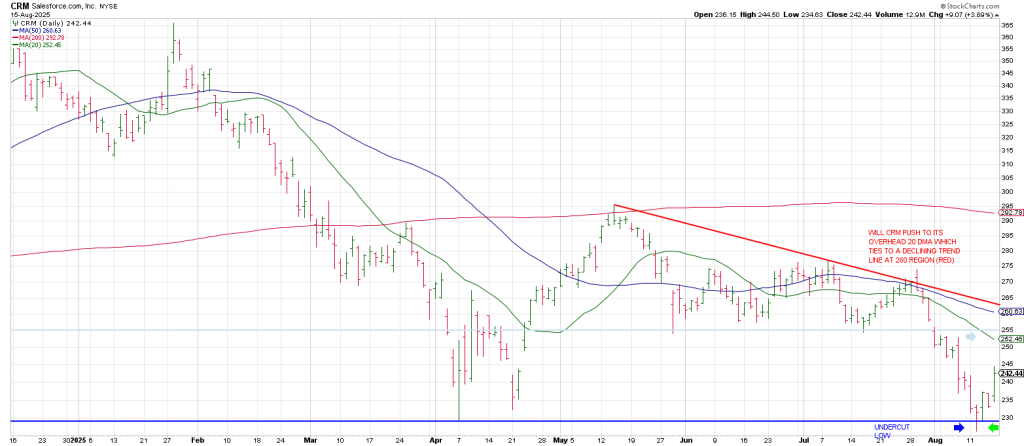
CRM commenced a persistent down-trend from a secondary high on January 28, 2025.
On the Square of 9 Wheel, 226 squares out with January 28th.
Not all square-outs are created equal.
When you combine price-action and pattern with square-outs the strong likelihood is a turn is on the table.
Notice that the August 12, 2025 low undercut the April 7 low and “tailed up” leaving a Lizard buy signal. A Lizard buy signal is a new 10 day low with the open and close near session highs.
CRM has rallied 10 points in 3 days from that Lizard buy signal.
CRM has not turned its 3 Day Chart up yet.
Horizontal resistance is 256.
Breakage above that opens the door to the declining 20 DMA which coincides with a declining trend line (red).
RDDT left a Momentum Gap on August 1st, 2025.
This is a large range breakout on a gap.
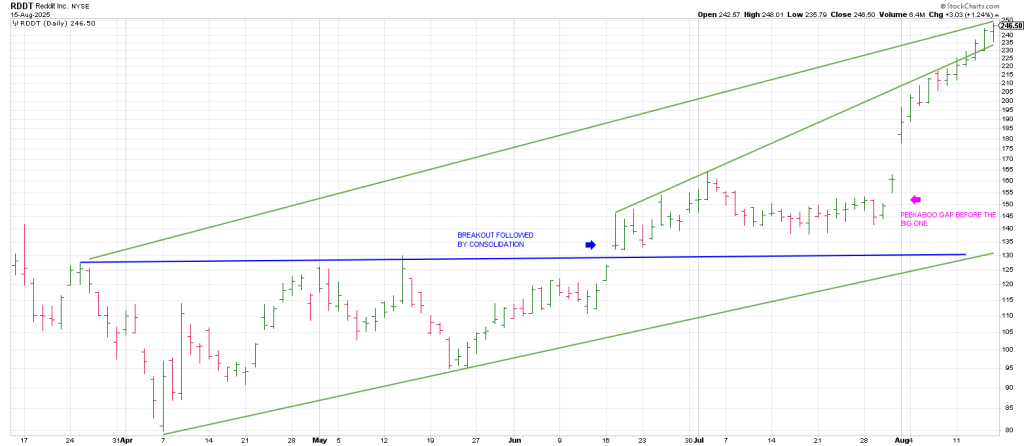
The implication from such Momentum Gaps in stocks that are below previous highs is that the previous highs will be tested/exceeded.
Exemplifying this momentum signal is that RDDT has not traded below a prior day’s low since the August 1 Momentum Gap.
Often times these Momentum Gaps occur on earnings.
These Momentum Earnings Gap or The MEG puts the stock in a monster move.
On April 7, RDDT carved out a Key Reversal Day with a low of 80.
720 degrees up from 80 is 168.
The August 1 Momentum Gap knifed right thru 168 opening the door to another 360 degrees higher
at 224.
With the prior all-time high being 230, RDDT cleared 224 last week running to 248.
August 15 squares the 80 low so the price action here now that the prior all-time high was exceeded must be watched carefully.
If upside momentum continues 255 is targeted being straight across and opposite 80 and 224.
Place Image E here
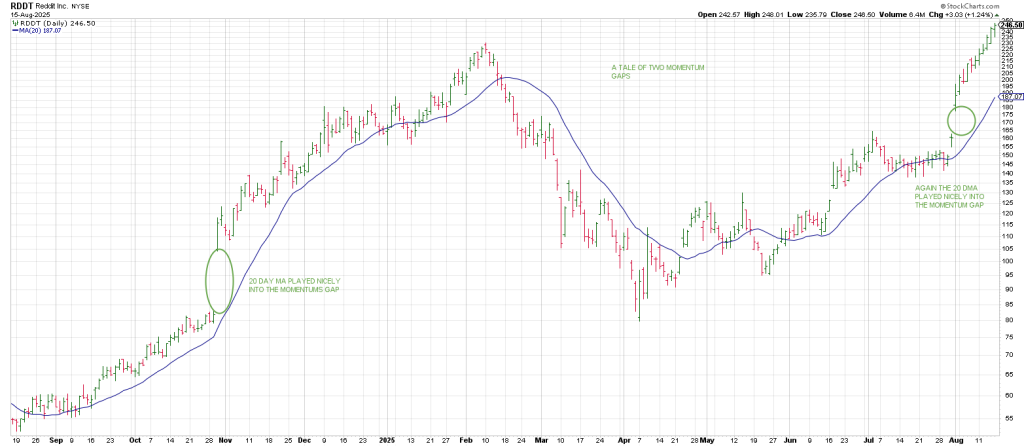
Stocks have their own personality and often follow previous behavior.
Notice the Momentum Gap in RDDT in October 2024.
It started a nice uptrend but it wasn’t a Rocket like the August gap.
HOOD bottomed on April 7th at 30 leaving large range Gilligan reversal.
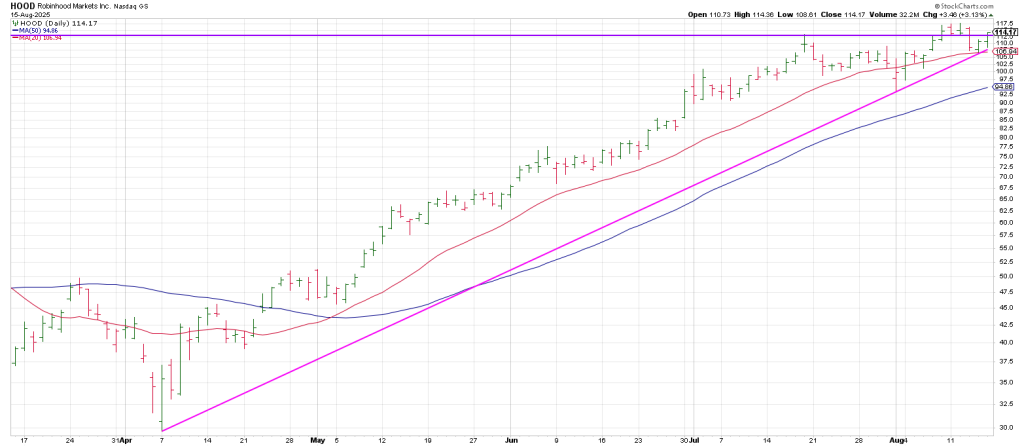
30 aligns with August 15
120 squares today if PLTR wants to test highs
On August 1, HOOD plunged below its 20 day moving average for the first time since it was reclaimed after the April low.
HOOD immediately reclaimed its 20 day but retested it on Thursday perpetuating a bounce.
Breakage again below the 20 dma underscores the importance of the August 12 square-out with the 30 price low.
SHOP is a name that Hit and Run members took long for earnings reported on August 6.
The April low was a Lizard buy signal on April 4.
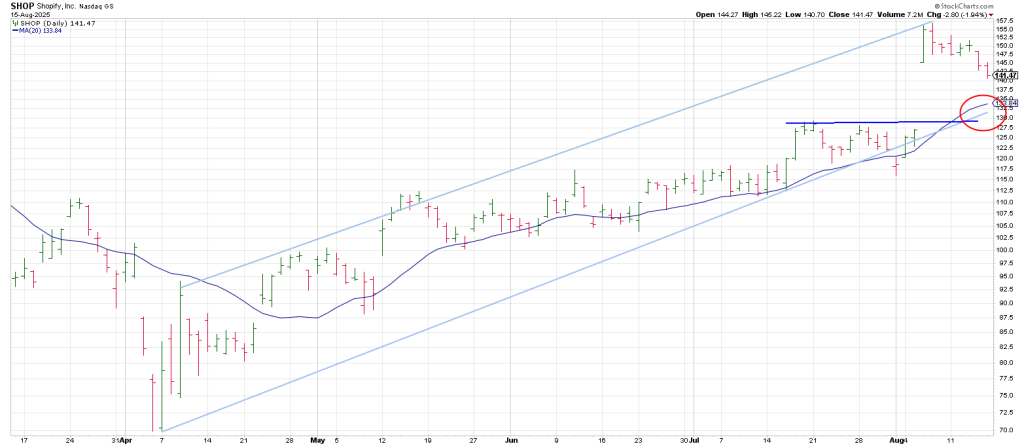
720 degrees up is 155.
SHOP exploded to 156.85 with an Earnings Gap and Go on August 6th.
This is why we played it into earnings.
Despite the MEG (Momentum Earnings Gap) SHOP did not continue higher like RDDT.
It left Train Tracks on August 6/7 perpetuating a pullback 140.70 on Friday.
Why the reversal after earnings?
157 is opposite August 7 on the Square of 9 Wheel for a perfected Time/Price square-out.
90 degrees down from 157 is 145. SHOP closed well below 145 at 141.47 opening the door to 180 degrees down at 133.
This would test the 20 day moving average into the open gap.
DASH is another earnings play that Hit and Run members captured this month.
However following earnings, DASH left bearish Train Tracks and went on to snap a trend line from the April low.
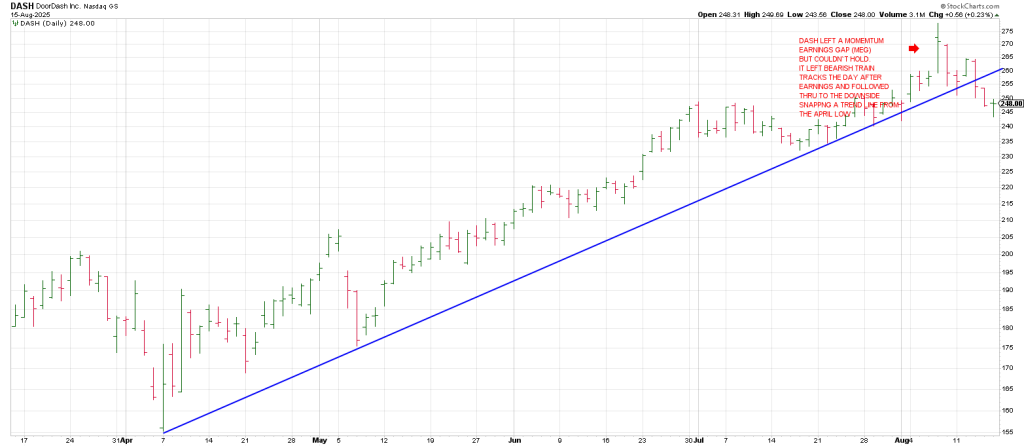
Why the reversal, why not continued momentum.
One reason may be that April 7, the low, squares out with 278, the high on August 7th earnings.
You can’t make this stuff up.
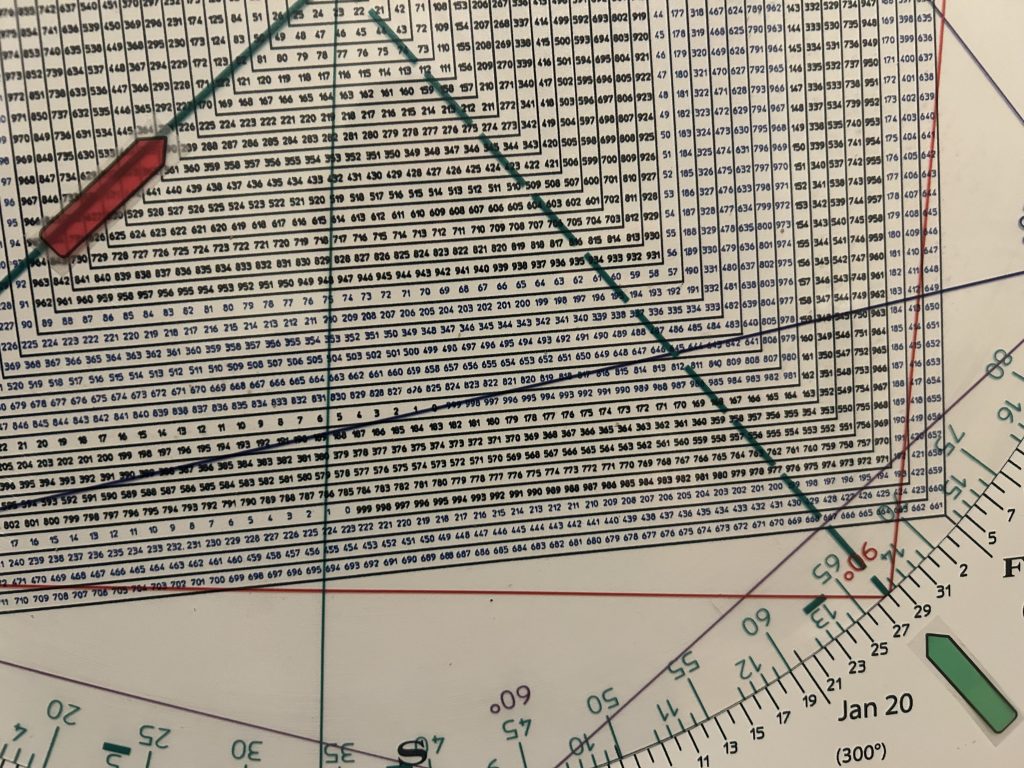
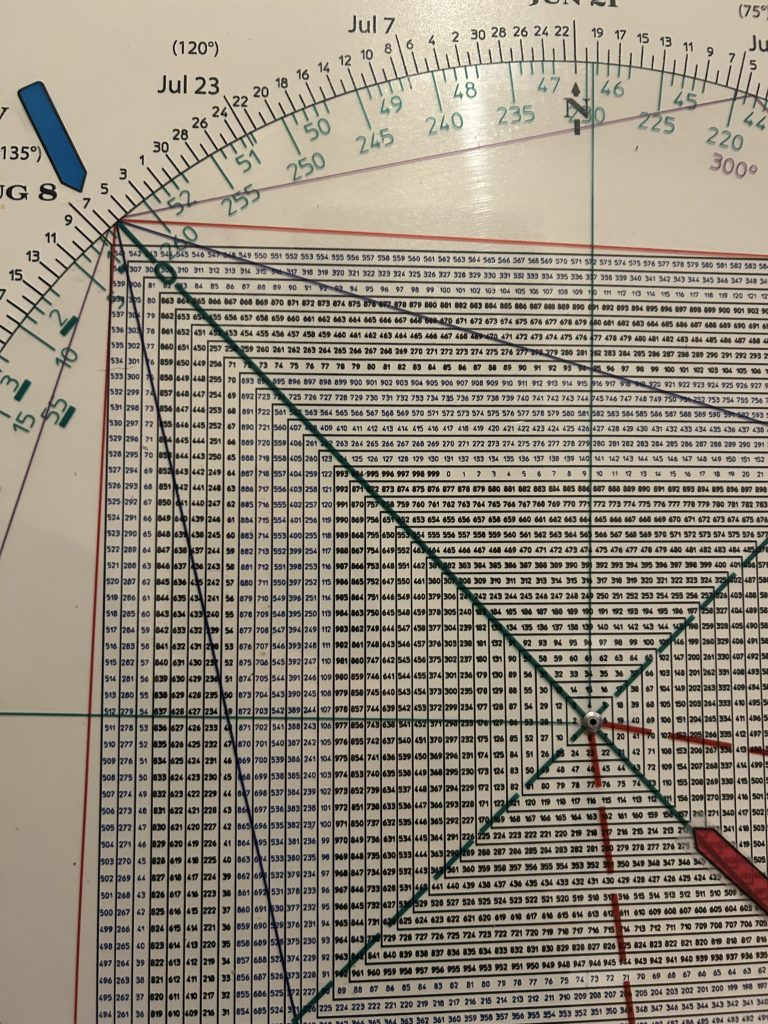
As well notice on the Sq of 9 image above that 274 is opposite April 7.
DASH was magnetized to a close below well below 274 at 271.
What does the Wheel have to say about the position of the SPX.
The SPX struck a high of 6479.61 (648)on August 13.
649 points to August 13 for a possible Time/Price square-out.
August 13 is a big anniversary of the 1982 August 12 major bear market low.
Maybe something, maybe nothing but it is the 43rd anniversary of that low.
43 is opposite August 12
Interestingly, 43 years from the major 2932 low is 1975.
December 1974 was the bottom of a major bear market.
How will we know The Turn?
The SPX has not pulled back for more than 2 consecutive weeks since the April low.
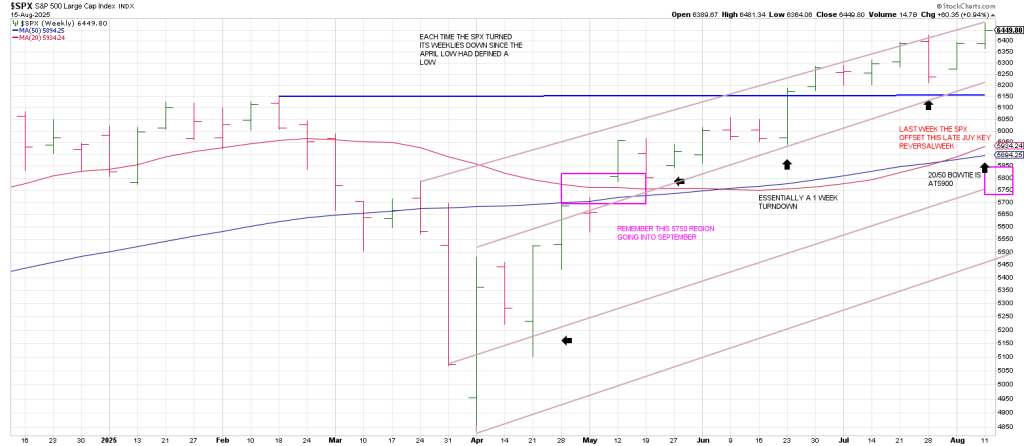
So we have only seen 4 instances where the weeklies have traded below a prior weeks low since April.
In essence they have all been one week turn downs.
The market has been in a hyperbolic advance despite 100 year divergences with internal breadth.
Remarkably the SPX left a Key Reversal Week on the week of July 28th and cleared that high last week.
That’s a bullish weekly Reversal of a Reversal that suggests higher.
If the index continues higher thru the 6480 potential square-out and the square-out with the August 1982 low, it could open the door to 669 or 696.
Projections off the 1929 cycle showcased in a write-up last week.
What if the index doesn’t follow thru on the promise of Reversing the Key Reversal Week?
We’ll walk thru that scenario in tomorrows article.
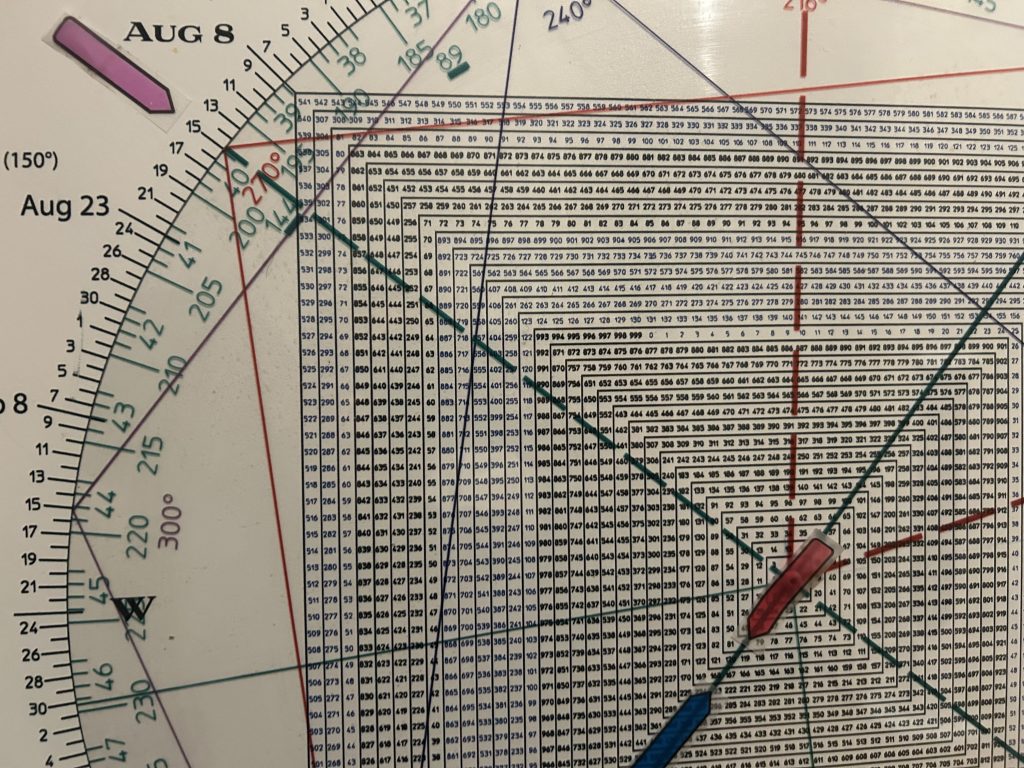
Above are just a few of the examples of how the Square of 9 Wheel helps traders identify potential price and time relationships based on geometric and numerical patterns derived from a spiral arrangement of numbers.
This works because growth is not linear but logarithmic.
It is based on the concept that price movements follow specific patterns that can be predicted using mathematical calculations.
LINK to my article What is the Square of 9?

Square of 9 Wheel
Purchase your own Square of 9 Wheel. Shipping to US only. Contact Jeff for shipping outside the US.
In sum, legendary trader W.D. Gann stated “When Time and Price square-out expect a change in trend.”
What he did not, but should have added, is that all important tops and bottoms are square-outs, but not all square-outs are important tops and bottoms.”
It is the behavior at these square-outs that will tell the tale of the tape.