“Oh, promised land
Oh, wicked ground
Build a dream, watch it fall down.” San Andreas Fault, Natalie Merchant
“They’re real and they’re spectacular.” Seinfeld
Yesterday we stated that cracks in the bull market were appearing and that the likely time-table for the market to cave in would presented in Tuesday morning’s report.
Another fissure developed in this secular tectonic bull market;
THE Mega Cap darling, NVDA, faltered after reporting last night.
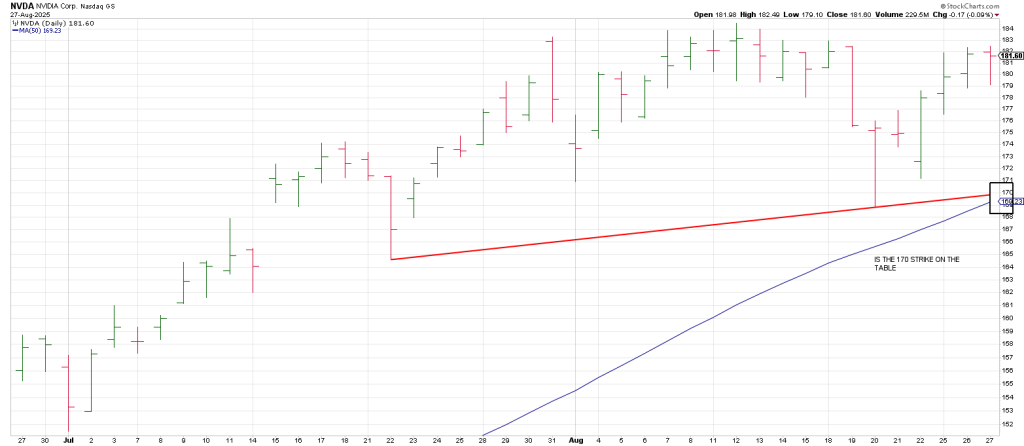
NVDA had struck a high close of 183 on August 12 which was a Time/Price square-out as
August 12 is direct to 183.
Time points to price, price points to time.
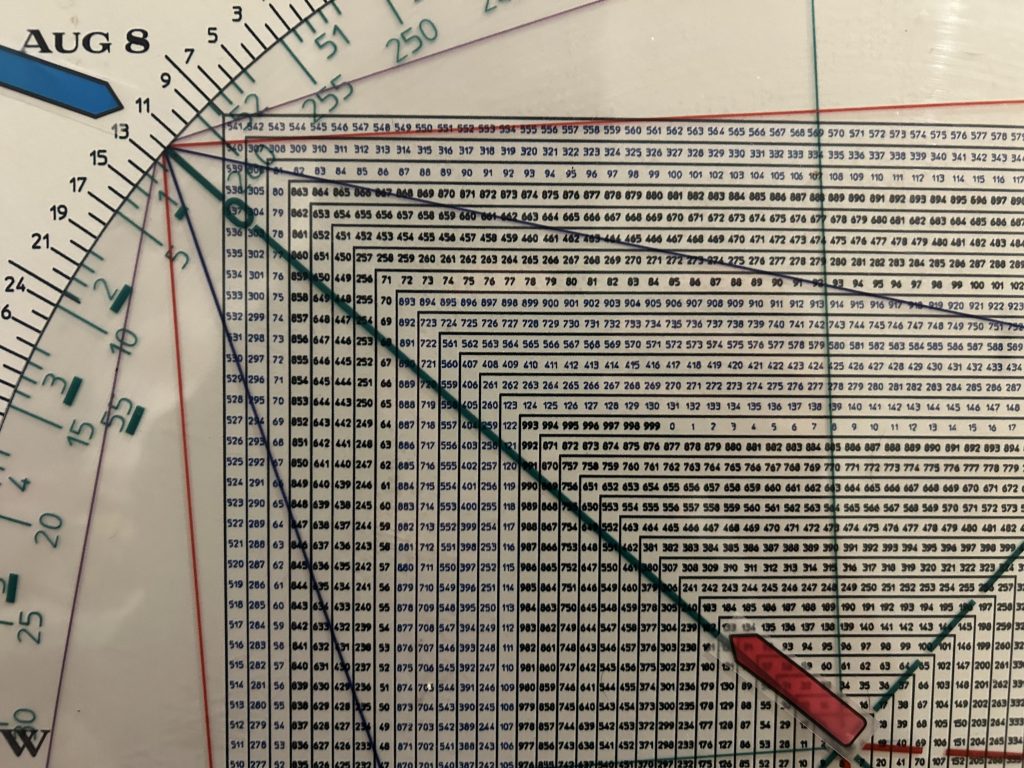

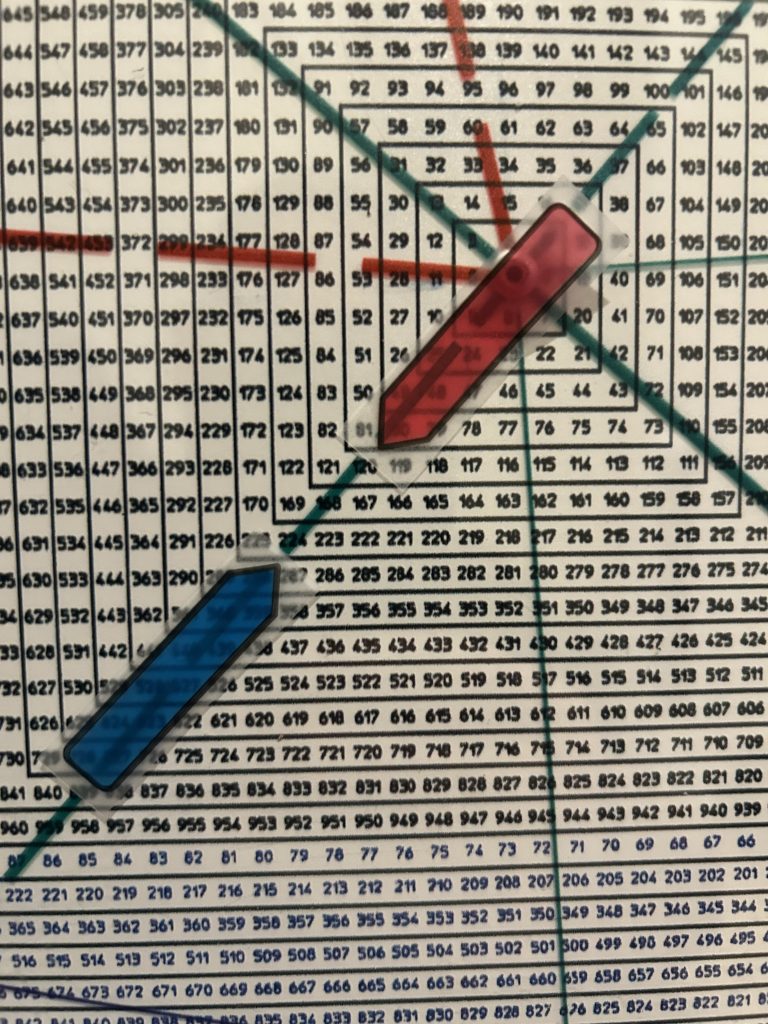
Square of 9 Wheel
Purchase your own Square of 9 Wheel. Shipping to US only. Contact Jeff for shipping outside the US.
As WD Gann, The Seer, wrote, “There is a definite relationship between Time and Price.”
This is the key to the amazing Square of 9 Wheel.
It doesn’t just project highs and lows based on the harmonics of prior highs and lows but it integrates Time and Price.
When Time and Price balance out, you have a “square-out”.
And when Time and Price square-out expect a change in trend.
Despite NVDA’s August 12 record high being an outside up day, the Time/Price square-out exerted its downside influence.
NVDA turned its 3 Day Chart down immediately off the top and importantly that turn down did not define a low.
NVDA kept declining towards a test of its 50 DMA
It was the first time NVDA did a drive-by of its 50 DMA since reclaiming it in April.
The normal expectation when a stock does something important such as testing its 50 DMA for the first time in months is to look for a low (or a high in the inverse).
Consequently, NVDA rallied off the Aug 20 test of the 50 day line.
It turned its 3 Day Chart back up on August 25th but never was able to cobble together an extension following that turn up.
Yesterday, after hours NVDA sank back below its 20 DMA at 179 closing at 176 and opening the door to another test of the 50 DMA and a possible Flamingo Low (two stick bar double bottom) with the August 20 low in the same 170 region of the 50 DMA.
Is it possible NVDA drops to the 170 strike for OpEx Pinball?
Interestingly Friday squares-out with 166 and 179 should it rally to backtest its 20 DMA…now overhead.
Maybe NVDA sticks the 180 strike for OpEx.
If we get breakage to the 50 DMA over coming hours/days it will install the 3rd test of an important rising trendline.
A rally from a 3 point trend line with a subsequent break opens the door to a fast fall.
Yesterday’s report walked thru the long setup for MDB in front of earnings.
Despite a “suspect” Bear Flag, pulling the lens back and Integrating the bigger picture with Square of 9 Time/Price harmonics hit paydirt.
Combo setups rule. That is to say pattern aligned with the Square 0f 9 are compelling risk/reward setups.
Amazingly MDB ran to 297. An Earning’s Gap and Go from its 282 after reporting.
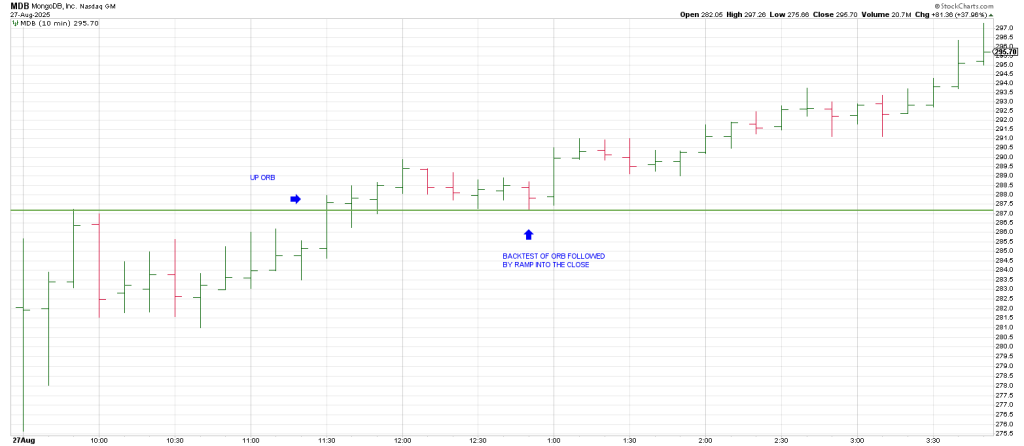
Amazingly the 295 region is 180 degrees straight across and opposite its April 7 low.
Knowing this fact, would have given one confidence to get long on an Opening Range Breakout on Wednesday in MDB.
An up ORB was triggered at 287.23.
MDB grinded to 397.
That ain’t hay.
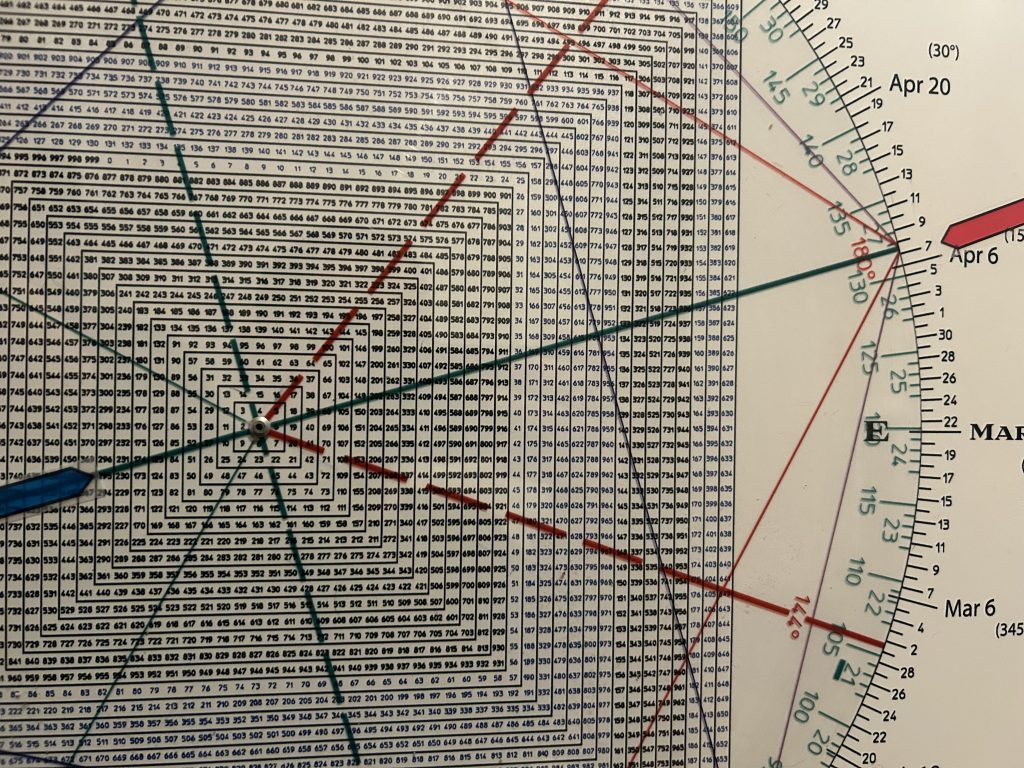
SNOW is another stock where the pattern looked suspect before its earnings print Wednesday after the bell.
However pulling the lens back to the weeklies shows a misshapen Cup and Handle.
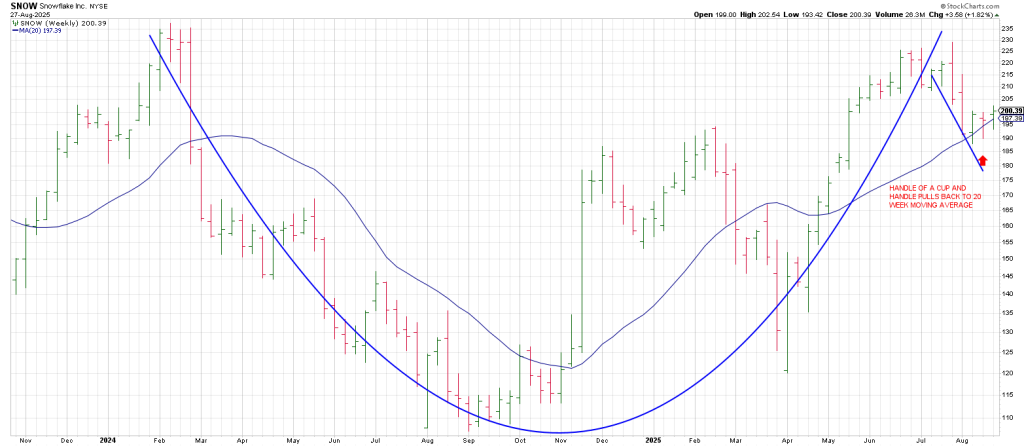
As well SNOW was sporting a weekly Holy Grail buy setup—a pullback to the 20 week moving average following a vertical run.
The last swing low in SNOW was 120 in April.
The Square of 9 below shows that one revolution of 360 degrees up is 168.
SNOW as trading well above that at 200 going into earning suggesting that the next 360 degree level at 224 was on the table.
SNOW ripped after reporting on Wednesday from 220 to close at 226.
You can’t make this stuff up.
After the close, I saw this comment on twitter.
“There’s not going to be another Bitcoin bear market for serval years.
Every Sovereign, Bank, Insurer, Corporate, Pension ,and more will own Bitcoin.
The process has already begun in earnest, yet we haven’t even captured 0.01% of the Total Addressable Market.
We’re going so much higher. Dream Big.”
$1 million Bitcoin is the floor.”
Love, Icarus (the sign off is me)
That’s the kind of tulip sentiment you get at historic junctures.
In sum, it is important to keep in mind three key components of every bubble—excessive leveraging, extreme valuations, and raging sentiment.
Using these metrics this is the greatest bubble of all time.
We’ll expand on this in depth over in reports next week.
Suffice to say that bull markets chew up extremes for breakfast.
As Gann stated “Only when Time is up does the trend turn”
Time is synergistic.
The 1929 top was on September 3rd 96 years ago. 96 “points” to September 23 when the Lehman Crash started in 2008.
1987 top was August 25th, 38 years ago. 38 “points” to October 24 where the 1929 crash started.
The 2000 crash started from a September 1st high. 2000 was 25 years ago. 25 “points to November 7 a few days from the bottom of the 1929 crash.
The Panic of 1907 was 118 years ago. 118 squares out with September 1st.
The 1907 panic ended on 11/11/07.
The fall will be spectacular.