From its waterfall low of Monday April 7th to last Thursday’s July 3rd all time high the SPX advanced 29.98%.
Monday, yesterday, was July 7th, 90 geometric Gann days/degrees from low.
Did the SPX put the proverbial Hook in my ‘breaking out’ after quarter-end implying that the window-dressing/markup was irrelevant?
Maybe, because yesterday while we didn’t get an Island Top with the sell-off, the SPX did dive below Thursday’s gap triggering a Jump the Creek sell signal.
And the index closed below the gap suggesting it may have been the cherry on top/an Exhaustion Gap.
We won’t know until we can look back what kind of top if one at all Thursday was, but my intuition is that it was A Top and not The Top.
Be that as it may, I do think there is a likelihood that the 2007 pattern shown yesterday plays out—with a Primary High in July, an air-pocket decline, and a Return Rally to a Secondary High in October.
As walked thru yesterday there is a lot of synchronicity pointing to a November peak.
The SPX advanced from April 7 at an annualized rate of nearly 180%,
Many, I mean MANY stocks have rallied considerably more as we all know.
Hundreds of stocks have advanced more that 50%, more than 75%, more than 100% from their respective April lows.
If one is long a stock in this vertical position, the idea is to take measures of some kind, to trim, to sell calls, to do something, before—as the expression goes, somebody does it for you.
These stocks as a group are judge to be vulnerable, extended sell candidates.
There are vulnerable to profit taking and/or shorting and the selling pressure associated is likely to perpetuated the pullback that is indicated by cycles due to exert their downside pressure.
The vast majority of traders, myself included, are on their heels about overstaying any short positions given the behavior of the last few months.
Hence I think it is reasonable to expect that Mr. Market in all his perversity will fake left and go right—go right to its 50/200 moving average Bowtie.
Currently that region is 5850 to 5900.
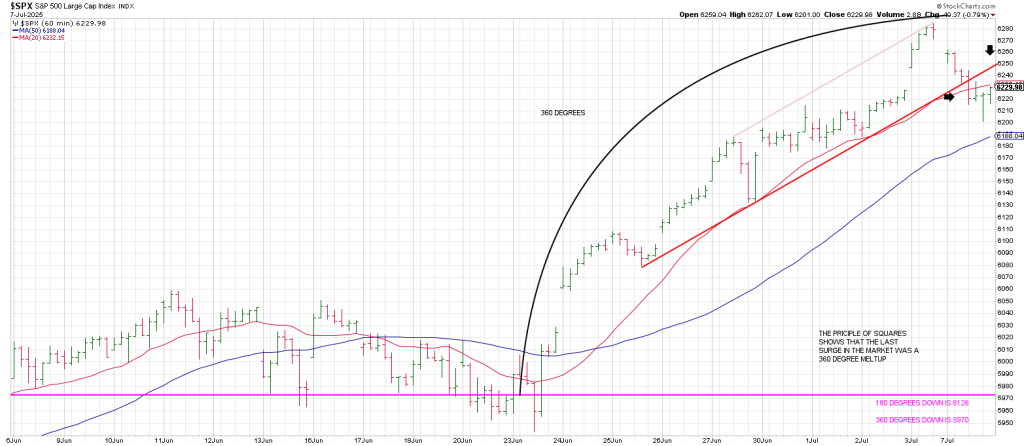
In sum, the SPX does show an Island Top in the sun if you drill down and look at the hourlies!.
1) The 3 Hour Chart turned down directly off its all-time high.
2) The 20 hour ma was snapped decisively.
3) The 50 hour ma was tested.
4) The SPX satisfied a 90 degree drop from high. This is 6205
The natural expectation is to get a bounce.
Yesterday on the private twitter feed, we pinged that I expect we could see a backtest of the broken hourly trend line and a backtest of the 20 hour ma.
It started late yesterday off a little undercut of 6205.
This morning we’re getting the full monte as the hourly SPX traces out a Minus One/Plus Two sell setup.