“People will pay more to be entertained than educated.” Johnny Carson
Last week turned out to be a great one for Hit and Run Trading, as the daily price action aligned almost perfectly with our day by day outlook.
This week will be a challenging one. If we don’t break support outlined below it will be choppy within the context of a relatively narrow range.
I was going to write about what everybody wants to hear about, the gold and silver markets today.
But based on the action in the futures Sunday night, I’ll save that for Tuesday…except to say that Thursday morning’s report stated that 509 squares-out with/ vibrates off January 29 and that GLD may top at 529 on Thursday’s open.
GLD opened at 509.51, pushed a tad higher to 508.70 and came unglued fall the most for one session as it had in decades.
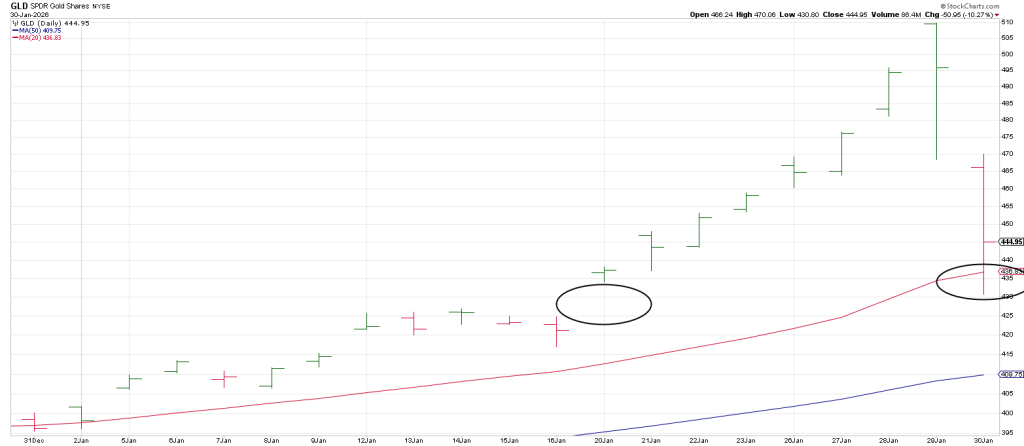
If you know of anyone else who had a method for nailing the top of GLD’s vertical rally, I’d like to know because I know of no other trading tool other than the Square of 9 Time and Price Calculator that is capable of nailing highs and lows when price is speeding.
As W.D. Gann said, “When Time and Price square-out, expect a change in trend.”
In my experience when price is spiking into a square-out, be it a high or a low, the odds of at least an interim turn are strong.
I can’t explain how the Square of 9 Wheel works other than to say that Gann explained it as the Law of Vibration.
Gann’s theory is that financial markets are governed by mathematical and harmonic laws where price movements and time cycles vibrates at specific frequencies, similar to energy.
When Time and Price balance out, they become one in the same.
Friday on the Hit and Run Private Twitter Feed we offered that if the SPX takes out Thursday’s low it sets up a Black Monday with:
1) A gap below the 50 day moving average
2) and breakage below the bottom of a trend channel connecting the December 17 and January 20 lows.
A daily SPX shows a Domino Effect on deck.
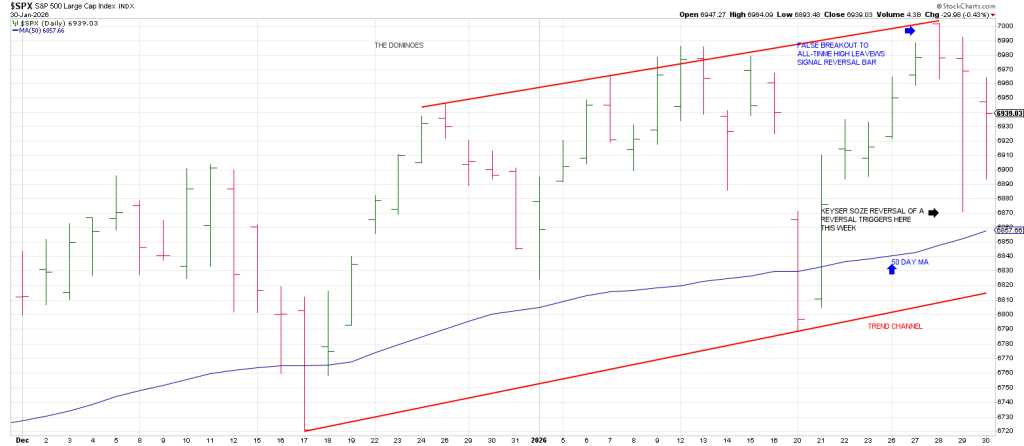
1) Thursday plunged but recovered leaving a long setup, IF the market could capitalize on it. I say IF because the SPX had just broken out to new all-time highs on January 28th and failed to hold. Consequently breakage below Thursday’s low that sticks is a Reversal of a Reversal or what I call a Keyser Soze, from the movie The Usual Suspects.
Fast moves come from false moves and the market has two potential false breakouts: the new high on January 28th and breakage below Thursday’s low.
2) Breakage below Thursday’s low will likely see follow through below the 50 day moving average. The SPX snapped its 50 day ma three times since October and recovered immediately. This time may be different in keeping with my cycle work. As well the late January high is 90 days/degrees from the October 29th high. Late last week may have been a Secondary High to the late October Primary High.
3) Breakage of the 50 day line opens the door to a failure below a trend channel connecting the 12/17 and 1/20 lows.
The Square of 9 Wheel shows the potential for a Black Monday.
Why?
Above we mentioned the false breakout on January 28th. This is when things in the metals market started to come unglued.
Late January ties the 1929 and 1987 Black Monday’s today/this week.
From the 1929 crash to the 1987 crash is 58 years.
From the 1987 crash to 2026 is 38 years.
From 1929 crash to 2026 is 96 years (+ 3 months)
A Square of 9 Chart show how these all vibrate with late January 2026.
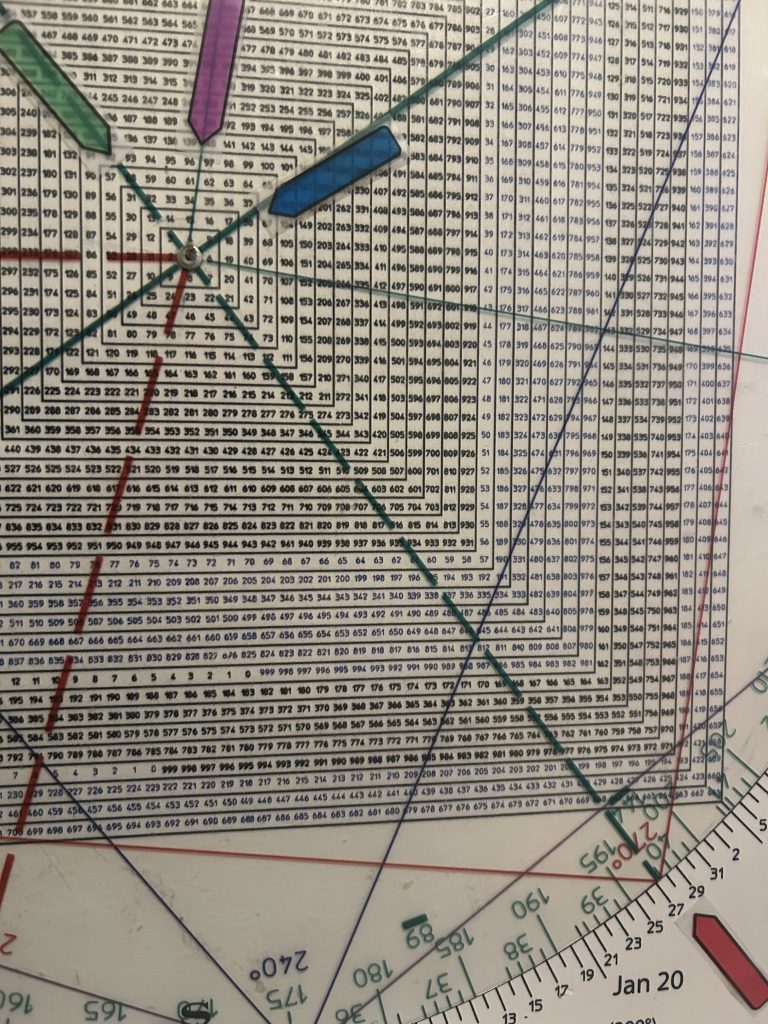
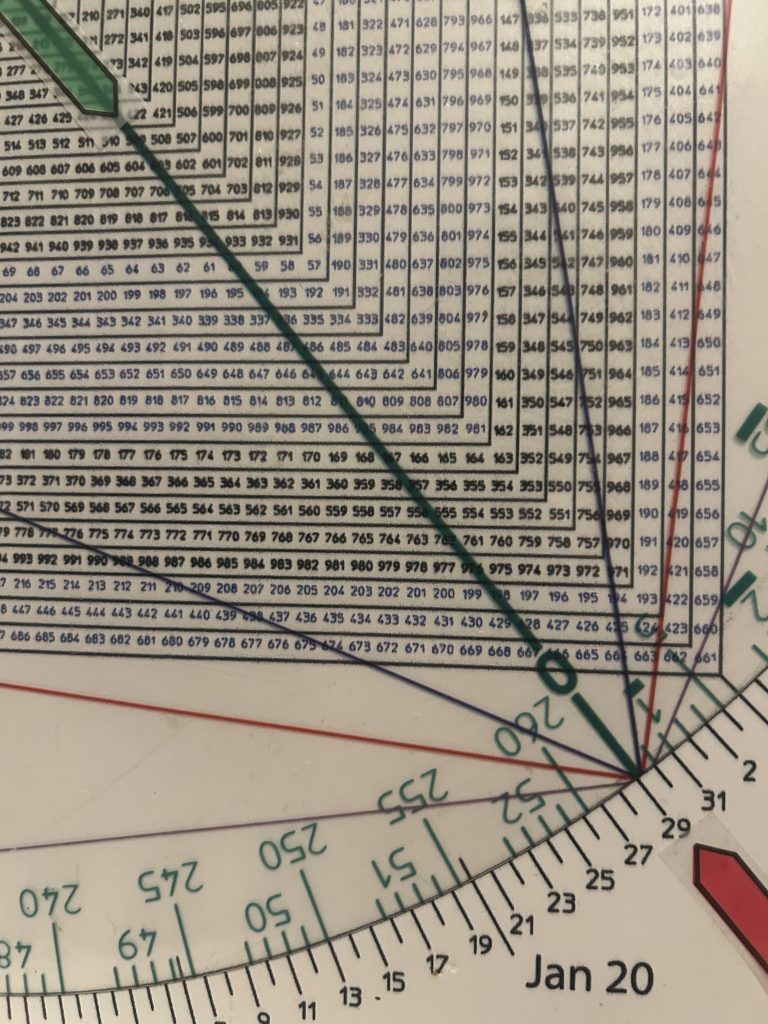
The green arrow points to 58 and vectors January 29.
The blue arrow points to 38 which squares January 29.
Between these two arrows is the purple arrow pointing to 96 which is 45 degrees between the green and the blue arrows.

Square of 9 Wheel
Purchase your own Square of 9 Wheel. Shipping to US only. Contact Jeff for shipping outside the US.
Risk-off is exploding as generals run from the battlefield.
In addition to precious metals minters, Friday saw sick reversals in glarmous like STX, SNDK, MU.
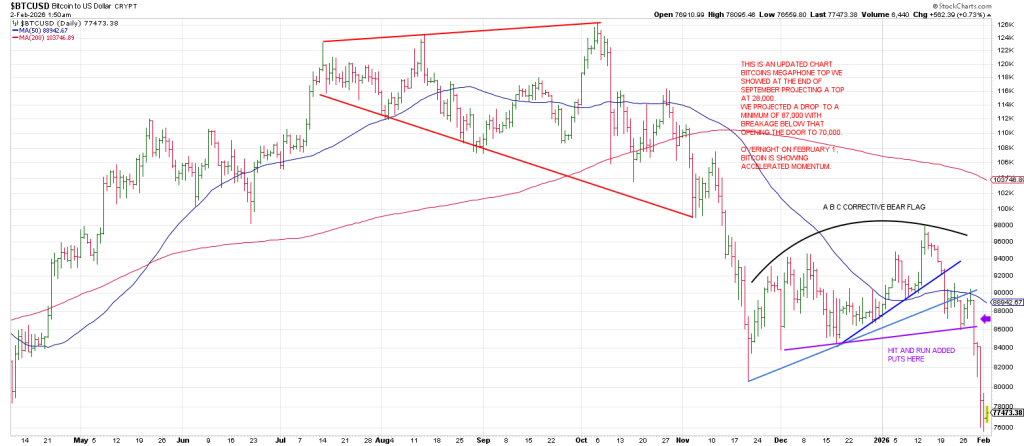
Bitcoin is crashing as it broke to new lows for the move. Our projection from late September to 70,000 is in play.
Cycles warn that the dominoes could trigger a waterfall decline to the 6000 region.
Half the range from the April, 2025 low is 5918.
The February 2025 peak is 6150 region.
If prior resistance (the Feb 2025 peak) becomes new support, cycles could exert their downside pressure magnetizing the SPX to the 6000-6100 region.
As well the SPX is severely elevated from its 200 day moving average which has not been tested in 8 months.
Caution is warranted.