“Now that you’re near
The time is here at last.” It’s Now Or Never, Elvis Presley
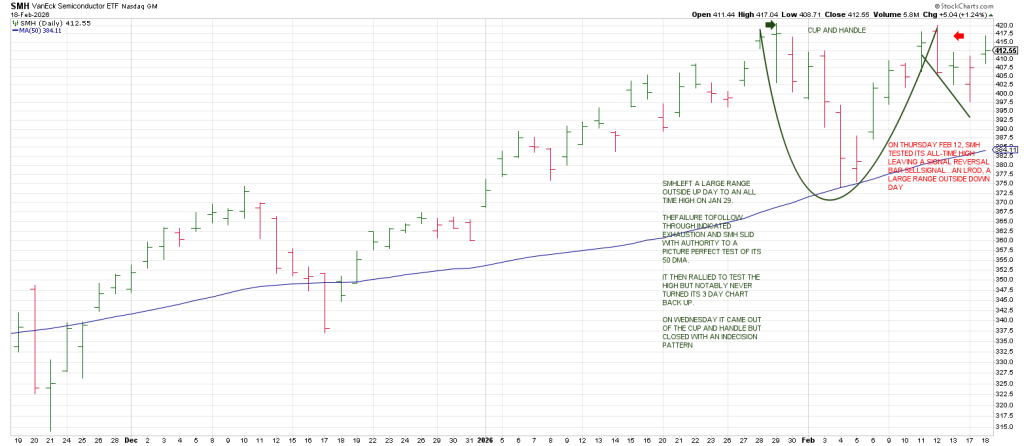
Below is the semiconductor ETFF, SMH.

SMH left a large range outside up day last Thursday January 29 to an all-time high but was unable to follow through.
When stocks don’t do what is expected they typically go the other way in a hurry.
Consequently, SMH slid to a picture perfect test of its 50 day ma—turning the important 3 Day Chart down in the process.
The rally off the 50 dma tested the all time high last Thursday but reversed leaving an LROD or Lighting Rod, a large range outside down day.
SMH came out of its Cup and Handle on Wednesday but closed with an indecision bar.
This ‘indecision’ is in keeping with the mixed price action of many important chip stocks on Wednesday and over the last few weeks.
MU left a Key Reversal Day on January 30 and got hit hard over the following sessions.
MU tailed off last Thursday following a test of the all time high.
Yesterday MU left a large range outside day within the context of a Cup and Handle.
All trading is contextual. In other words signals don’t exist in a vacuum but within the context of a pattern of distribution or accumulation..
Above the Tops Line from the all-time high should open the door higher; however, MU is dealing with 3 large Topping Tails in close proximity—Jan 30, Feb 3 and Feb 12—what I call Charlie’s Angels sell pattern.
MU is exemplifies the position of many glamours: It’s either on the verge of a breakout for a leg higher or it’s forming a Secondary High.
Notice that the January 29 Key Reversal Day/Gilligan sell signal hit 90 days/degrees from the October 29 high in the QQQ.
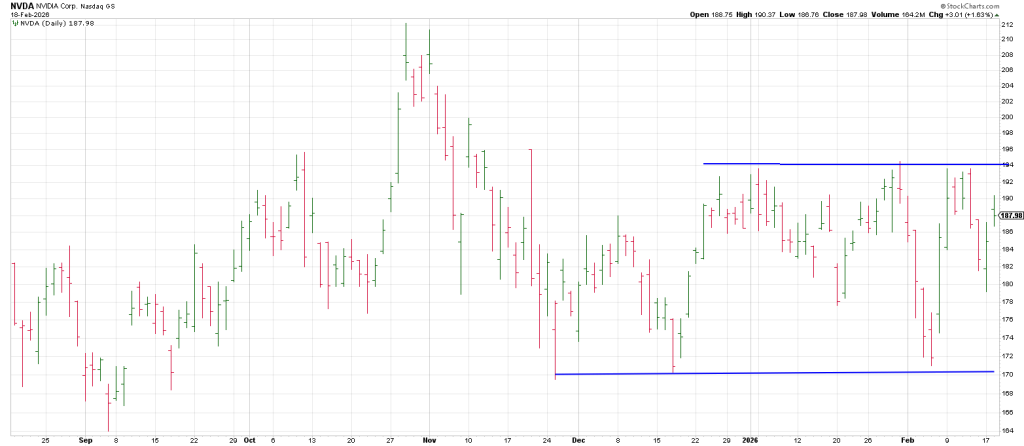
NVDA epitomizes the indecision pattern in tech.
It is entrapped by triple tops on the topside and triple bottoms on the downside.
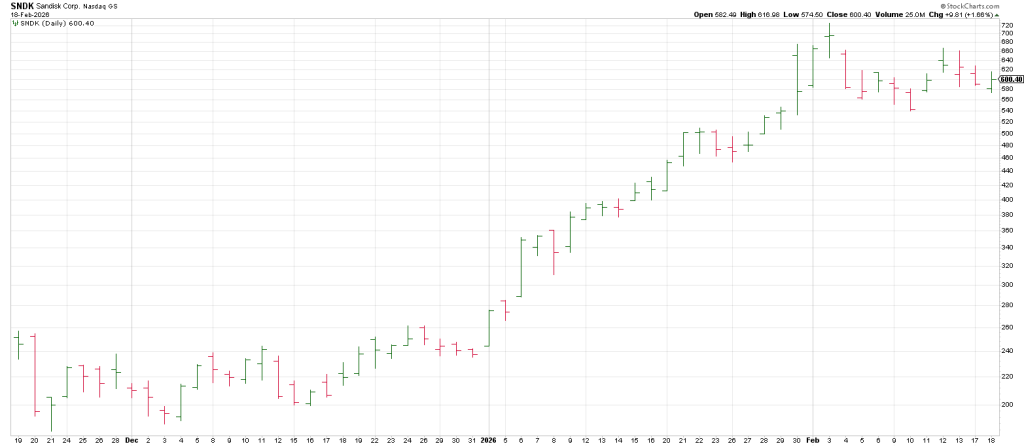
SNDK left a large range reversal on January 30 and remarkably rallied to eclipse that high two sessions later.
However, it was a pyrrhic victory as it reversed hard immediately from its February high,
Now after testing its 20 day ma twice and forming what may be a misshapen Cup and Handle, SNDK has an Elvis setup: it’s now or never as a reversal back below the 20 dma suggests early Feb was the top of a Climax Run.
WDC is another glamour that looks suspect.
It left a Combo sell signal last Thursday (a Lizard and a Soup Nazi sell and Charlie’s Angels).
Wednesday it shot up to a new all time high but tailed off to close below the middle of the range.

CAMT is a semi that saw a Gap & Go turn into a Gap & Crap.
In so doing it left a Combo sell setup—a Lizard and Soup Nazi sell signals.

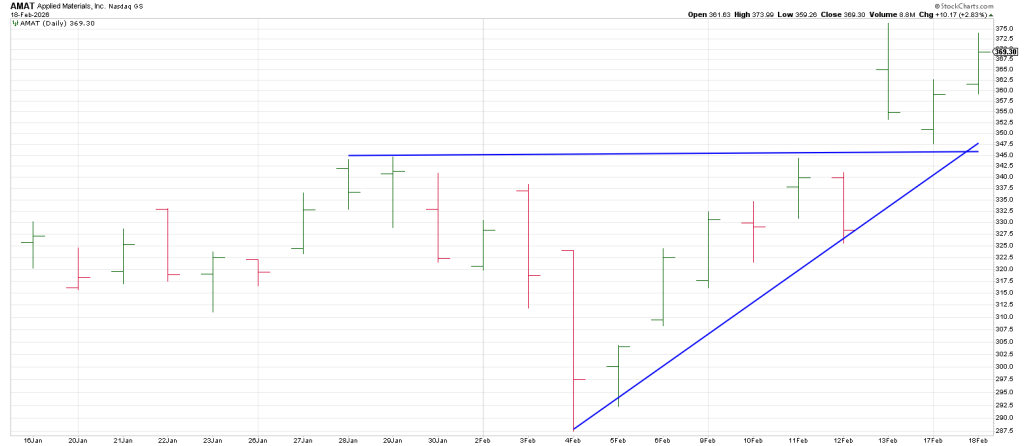
AMAT exploded after reporting on Friday leaving a TD buy setup on Monday—the first turn down in the dailies following a thrust and followed through on Wednesday.
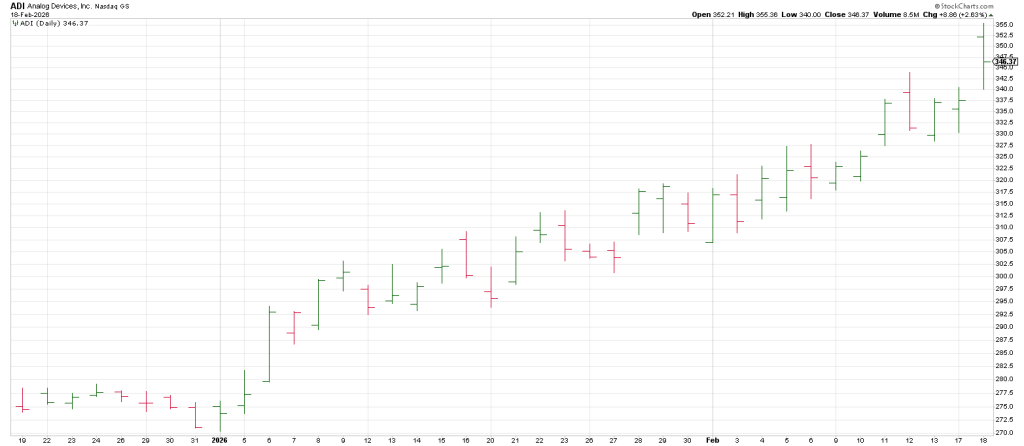
ADI exploded after reporting but tailed off to Phil D Gap before rebounding leaving an indecision bar.
TER looks set to extend today.

It turned its 3 Day Chart down on Tuesday and left a 180 buy setup.
Clearing last Thursday’s Key Reversal Day high triggers a Keyser Soze continuation buy…a Reversal of a Reversal.
Fast moves come from false moves.
In sum, many generals tailed off on Wednesday, leaving the market suspect.
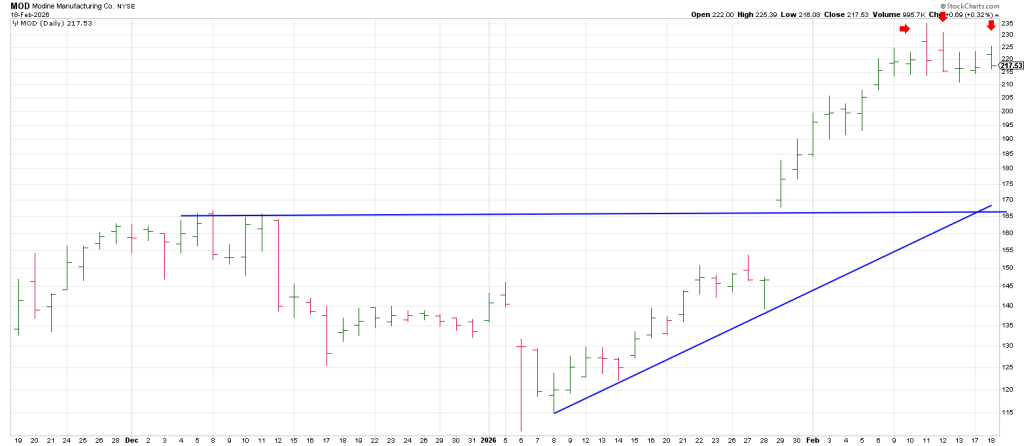
MOD shows a Charlie’s Angels sell pattern
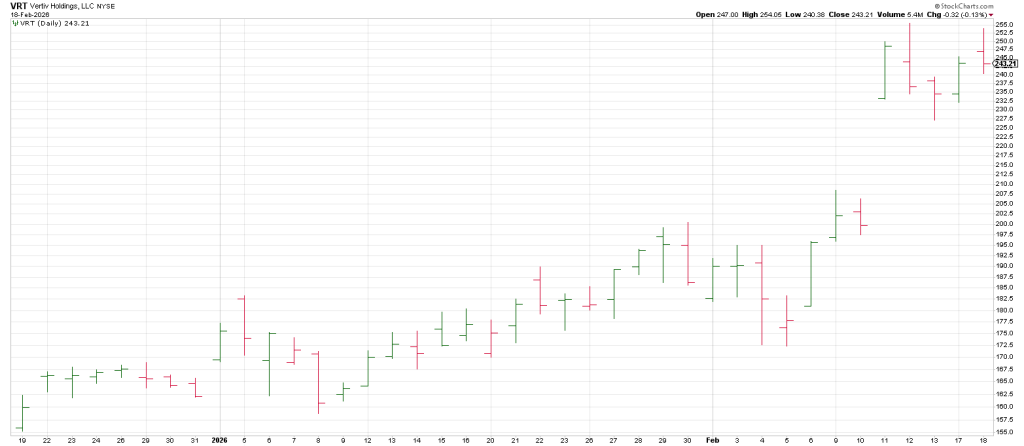
VRT rallied initially but then reversed after testing last Thursday’s reversal high.
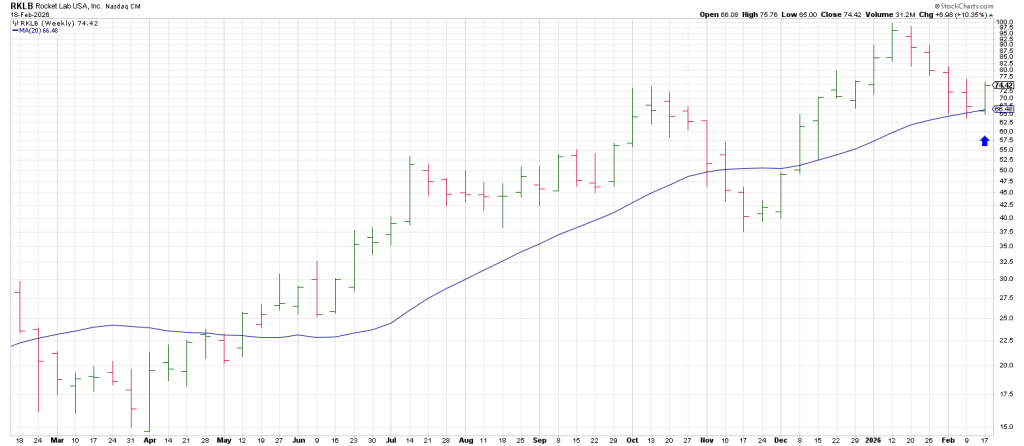
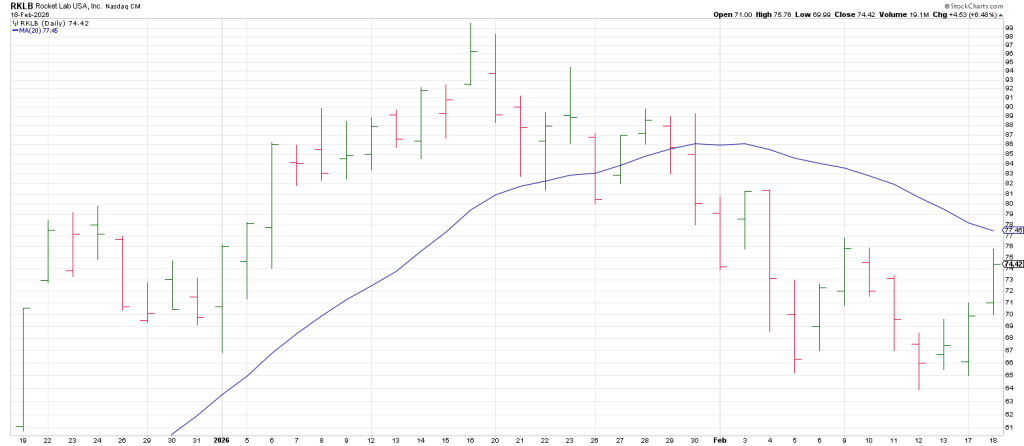
Hit and Run took RKLB long intraday on Tuesday at 67.75. as it had tested its 20 week moving average and turned its 3 Week Chart down.
Yesterday we exited as it tested its 50 day line.
In sum we use multiple time frame pattern analysis in conjunction with our Momentum Method to Identify explosive moves before they occur.
In a strongly trending market, up and down, the trend is your friend with swing positions being the viable strategy.
However, in unforgiving, choppy markets like the one we’re in, our strategy is to trade like a sparrow.
The sparrow swoops down takes a little piece of bread and flies away and repeats this over and over.
He doesn’t sit there and try to eat the whole piece of bread. They may have to make 100 stabs at a piece of bread to get what a pigeon gests at one time. But that is why a pigeon.
You will never be able to shoot a sparrow, it’s too fast.
The sparrow will never be a sitting duck
The market has been wearing out bulls and bears since October.
When Mr. Market finally decides to trend, bulls and bears will be hesitant, sparrows will be ready to swoop.
The other piece of puzzle is solved by the Square of 9 Wheel that does an amazing job of identifying turns.
WD Gann stated, “When time and price square-out expect a change in trend.”
The SPY struck an all time high of 698 on January 28.
This is geometric cycle of 90 days/degrees from the Oct 29 “anniversary” high.
I believe the October high was the Primary High and that January 28 was likely a Secondary High.
As well, 698 aligns with/vectors February 18, yesterday.
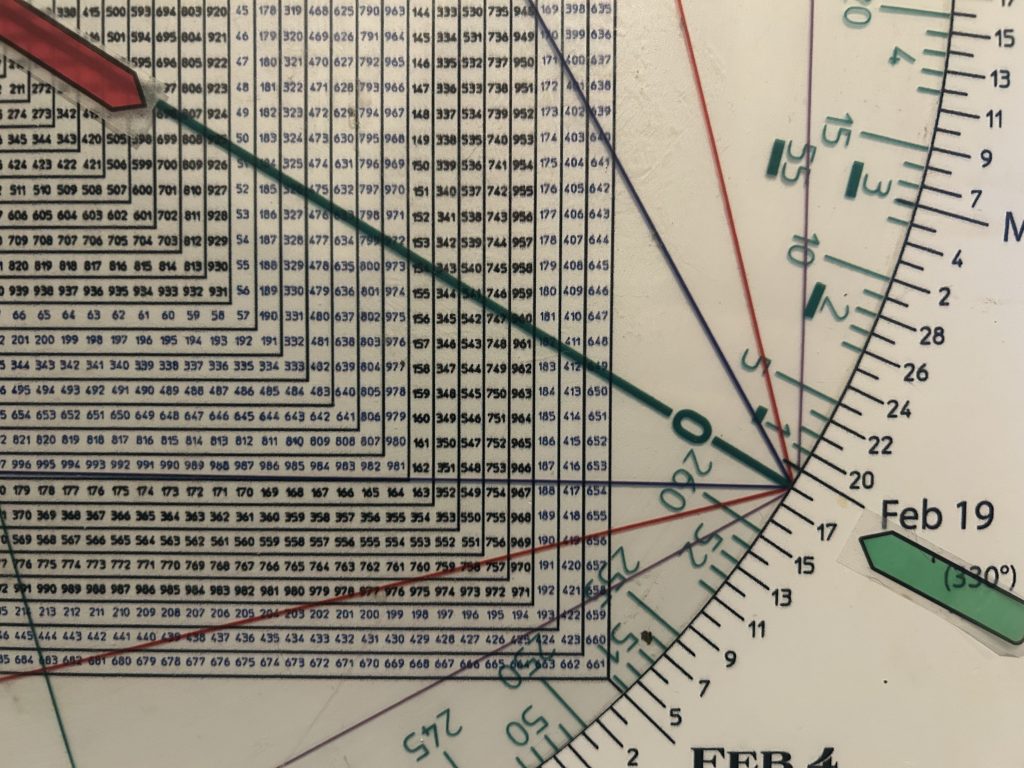
Yesterday’s SPY test of its 20/50 day moving average Bowtie may have been the last graceful exit prior to breakage below the triple bottoms at 675.
For the bulls, it’s now or never.

Square of 9 Wheel
Purchase your own Square of 9 Wheel. Shipping to US only. Contact Jeff for shipping outside the US.
Grab a free ebook of how the Sq of 9 Wheel works at cooperhitandruntrading.com