“In and out the window
Like a moth before a flame.” Box Of Rain, Grateful Dead
“That which is not but should be is more real than that which merely is.” Zoe Lund
The US is addicted to debt.
Cold turkey may be a market crash.
We are in the Gann Window.
That’s what it may take for people to realize how nightmarish our economic problems have become.
The sad fact is that we are living n the biggest debt bubble in the history of the world.
All of this debt makes the present more pleasant…but ultimately it destroys future generations who will look back at what we’ve done in horror.
Maybe I’m being overly dramatic.
I’ll let you be the judge of these Malignant 7.
1— Government spending is expanding at an exponential rate.
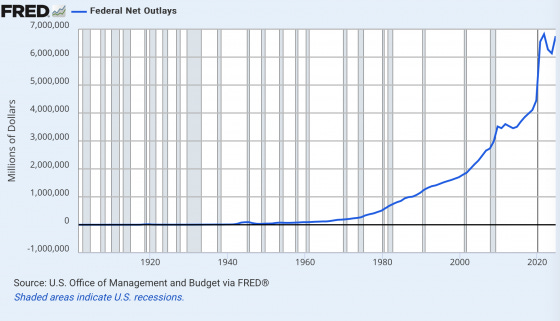
Federal spending is now roughly 14 times higher that is was in 1980-82 when the last Super Cycle began.
Federal spending is about three trillion dollars higher per year than it was during the last full year before the pandemic.
2— U.S. government debt is exploding. The U.S. government is 36 trillion dollars in debt. Insane. Our national debt is approximately 36 times larger than when Ronald Reagan entered the White House.

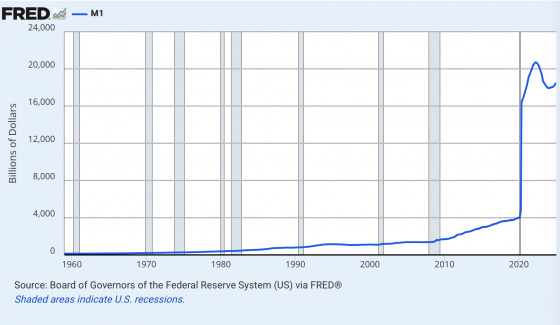
3—The growth of our money supply is a horror show. Look at how rapidly M1 has been rising over the last few years. During the pandemic, M1 went from $4 trillion to more than $20 trillion. The Fed is guilty too.
What is the price for driving 120 down this road with blinders? Is there any way to avoid paying a price?
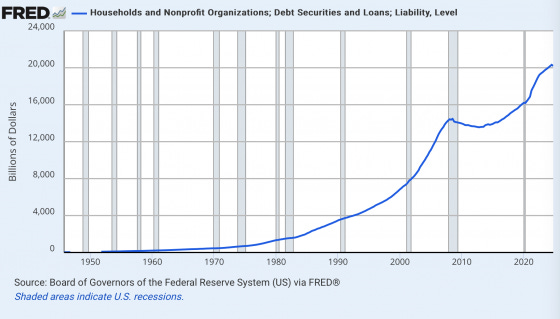
4— Household debt has soared to unbelievable levels over the past 30 years.
The truth is that it is not just the U.S. government that has massive a massive debt problem.
U.S. households have also been accumulating debt at a staggering rate. Total household and nonprofit organization debt did not pass the $2 trillion mark until the mid-1980’s, but now U.S. household and nonprofit organization debt has sur passed the $20 trillion dollar mark. Household debt alone accounts for approximately $18 trillion of this total.
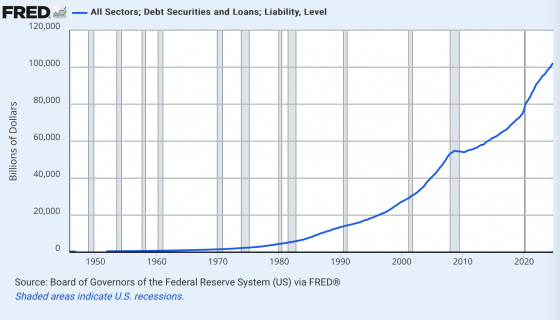
5—- The total of all debt (government, business and consumer) in the U.S. is now well over 100 trillion dollars.
If anyone doubts that our society is addicted to debt just show them this chart. This is a debt bubble that is unprecedented in U.S. history.
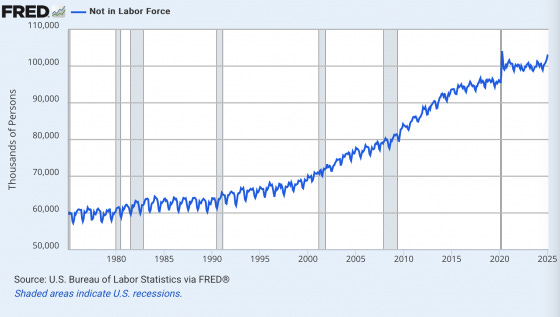
6— More than 100 million U.S. adults that do not have jobs are considered to be “not in the labor force”.
When a U.S. adult is not working they are just put onto one of two buckets. For years, government bureaucrats have kept the number of Americans that are “officially unemployed” at a very low level, while the number of Americans that are dumped into the bucket labeled “not in the labor force” has just kept going up and up. During the Great Recession, the number of Americans that were considered to be “officially unemployed” plus the number of Americans that were considered to be “not in the labor force” never exceeded 100 million. Today, the number of Americans that are considered to be “not in the labor force” alone exceeds 102 million.
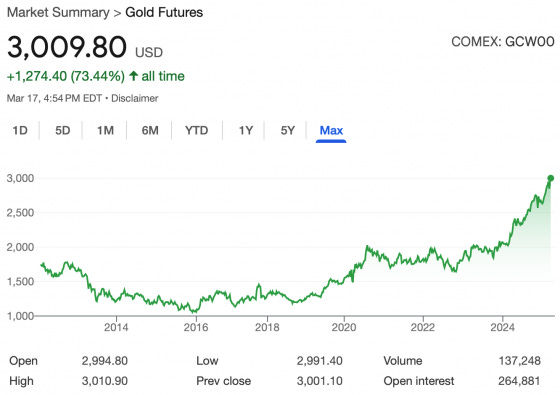
7— Gold has been running hot. That is not a good sign. When instability hits the financial markets, many investors flee to gold. This is especially true in inflationary times. Since the Fed was created in 1913, the value of the U.S. has declined by close to 99. One of the reasons given for the creation of the Fed was that the Fed was supposed to help control inflation.
That didn’t exactly work how too well. The truth is that the United States never had consistently rampant inflation until the Fed took control.
In particular, once the U.S. totally went off the gold standard in the 1970’s, inflation really started escalating out of control. When the gold standard ended an ounce of gold was worth $35. Today an ounce of gold is worth more than $3,000.
You don’t have to believe in cycles.
You don’t have to believe in charts.
The U.S. economy as it currently stands is unsustainable.
It is only a matter of time.
One day Humpty Dumpty is going to fall off the Wall of Worry.
It’s playing out in front of our eyes.
But few believe what they see.
If volatility precedes price, then price is going to accelerate.
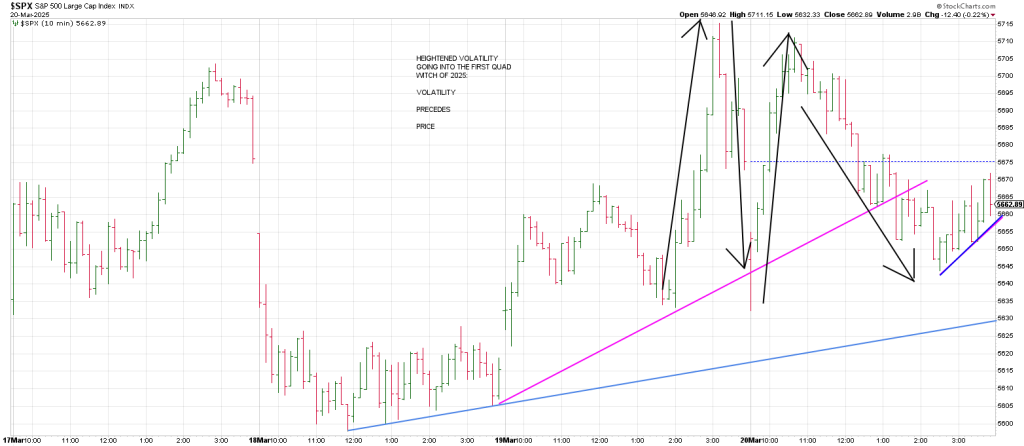
The SPX tested the March 17th highs twice in the last two days in a Test of a Test Failure pattern perpetuating Thursday’s late downside reversal.
The last hour and a half carved out a micro Bear Flag.
Breakage opens the door to the light blue Bottoms Line.
And then it’s Katie Bar the Door as pulling back the lens shows a big picture Inverse Cup and Handle.
The presumption is a drop to the August lows is on deck.