“Synchronicity is an every present reality for those who have eyes to see.” Carl Jung https://www.youtube.com/watch?v=t0S5otgB-yo
“With 90 degrees down from high at 6022 near the 20 day moving average, that’s the downside pivot. Breakage below 6022 opens the door to 180 degrees down which is 5945. Momentum below the 20 day moving average could surprise those betting on a Santa Rally with a snow ball to the 50 day line which ties to the 5945 region which ties to the aforesaid 5945 region.
Is a 100 point drop possible for OpEx Pinball?”
The above is from yesterday’s Hit and Run Report, Hawks, Doves or Chickens…as in chickens coming home to roost.
The bulls weren’t ready for a crash, the bears weren’t ready for a crash…particularly during positive seasonality. Markets don’t crash into Xmas, do they?
Well they did 6 years ago in 2018. Another Powell Pivot Christmas present.
6 years is an important cycle as it is a true ‘square-out’. A true square is a 6-sided cube.
This squares the circle or cycle. Each side of a cube being a full 360 degrees.
Let’s take a look at the synchronicity that ties 1929 to 2000, to 2024.
These are the years that show the highest CAPE Ratio measuring how overbought a market is on a cyclically adjusted P/E ratio.
A month ago we forecast a potential major turning point for December 7th (+ or -).
The DJIA topped on December 4th this year.
The SPX topped on December 6th.
I think there is a strong likelihood that those highs will last for a long time.
W. D. Gann stated that anniversaries of major prior highs and lows are important to watch for turning points in the future.
Dec 6, 1974 was the closing bear market low following a 2 year 50% collapse.
December 4, 1987 was the closing low after the October crash that year.
We are 50 years from the 1974 low, mirroring the 50 year period from the 1932 low to the major 1982 low. A low to low, low to high cycle?
The two biggest crashes were 1929 and 1987, their tops were within a week of each other: late August/early September.
Speaking of anniversaries,
This December 7th was the 83rd anniversary of Pearl Harbor.
On the square of 9 Wheel, 83 aligns with/vibrates off October 24th.
That was an historic event in 1929. It is the day the air came out of the Roaring Twenties Bubble.
Just like yesterday.
1929 was the top of a 5 year bull run.
We are in the Wheelhouse of a 5 year bull run from the Covid low in 2020.
The first week of December is 90 degrees square the first week of September, the peak in 1929.
A peak that lasted 25 years.
On the Square of 9, December 4th, the DJIA high, is on the same axis as 24.
The 2000 Bubble Top was 24 years ago.
December 4th squares early March, the NAZ high in the year 2000.
So the NAZ high in 2000 is opposite the DJIA high in 1929.
The aftermath of both highs is a mirror image.
From the 1929 top to the 2000 top is 70/71 years.
70/71 is opposite early September and squares early December.
Importantly, notice that December 4th is straight across and opposite 667, the SPX bear market low in 2009…squaring early September (1929) and early March (the low in 2009 and the NAZ top in 2000).
We’ve had the 6100 region on our radar as a possible top for a while.
This is because 609 (6090) is on the same axis as 349 (3490) the October 2022 low.
In fact 609 is 3 revs of 360 degrees up from 349 representing 1080 degrees.
This is an important measure in Time and Price.
A gorilla rang the doorbell yesterday.
This isn’t a stunt like the guy dressed in a gorilla suit who shows up at the sorority.
This gorilla isn’t wearing an outfit.
It’s the real deal.
The market has announced this moment with months of historic divergences showcased in this space.
A picture is worth a 1000 words.
Mr. Market also announced it was on a cliff by virtue of its Rising Wedge shown in yesterday’s report.
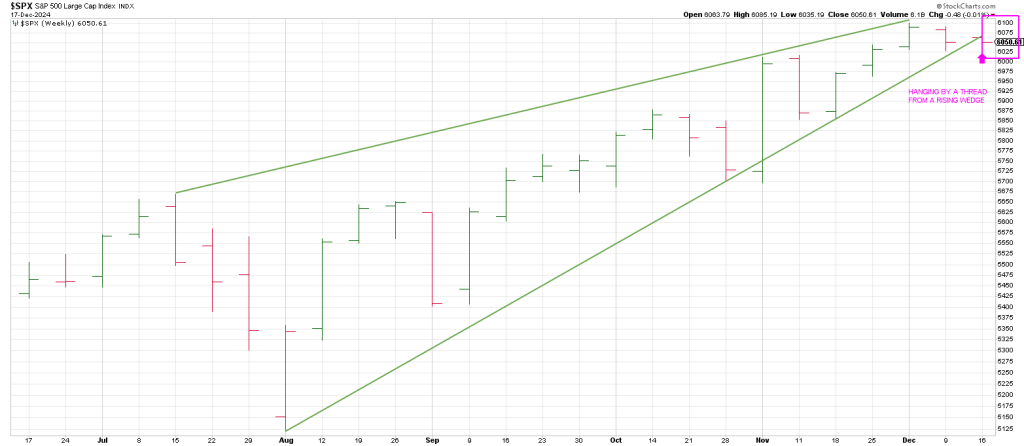
We stated that the SPX was hanging by a tread from this Rising Wedge.
Drops out of Rising Wedges are usually swift and sharp.
Price returns to where the Rising Wedge started, where the bodies are buried.
This Rising Wedge started from the August 5th low of 5100.
There is a strong likelihood that 5100 is a banana for this gorilla ringing the doorbell.
Mr. Market has done a stunning job of disabusing bulls and bears alike of the risk that has been raging.
Namely, by rebounding back from the early August Flash Crash, Buy The Dip became Buy the Crash.
Ditto the Covid Crash the comeback for which became the poster child for Buy The Crash.
In short, there is an expectation build up over the last 15 years that every downdraft is a buying opportunity.
The most recent example cited, the 2024 August Flash Crash is set to be memorialize in history my saying: “the first mouse gets the squeeze, the second mouse gets the cheese.”
In other words the first sell signal, off the July peak, saw a 1000 point SPX squeeze.
This sell signal will get the cheese for the bears.
Tomorrow’s report will walk thru the timing for the Great Unwinding.
In sum, stocks got cratered on Wednesday, It was one of the largest one day declines ever.
It came just a few days after the market produced a third simultaneous Hindenburg Omen crash signal on Dec 16.
The SPX delivered its 5th largest daily decline ever, Outside of the Covid Crash, it was the worst daily point decline in the SPX in history.
The NAZ saw its second largest one day drop ever on Wednesday.
Outside Covid, it was the largest point drop every in the NAZ.
No small feat.
The DJIA had its 11th worst one day decline ever. Outside of Covid it was the DJIA’s 4th worst point drop ever.
We invite you, implore you, to read our forecasts of what is coming accessing cooperhitandruntrading.com
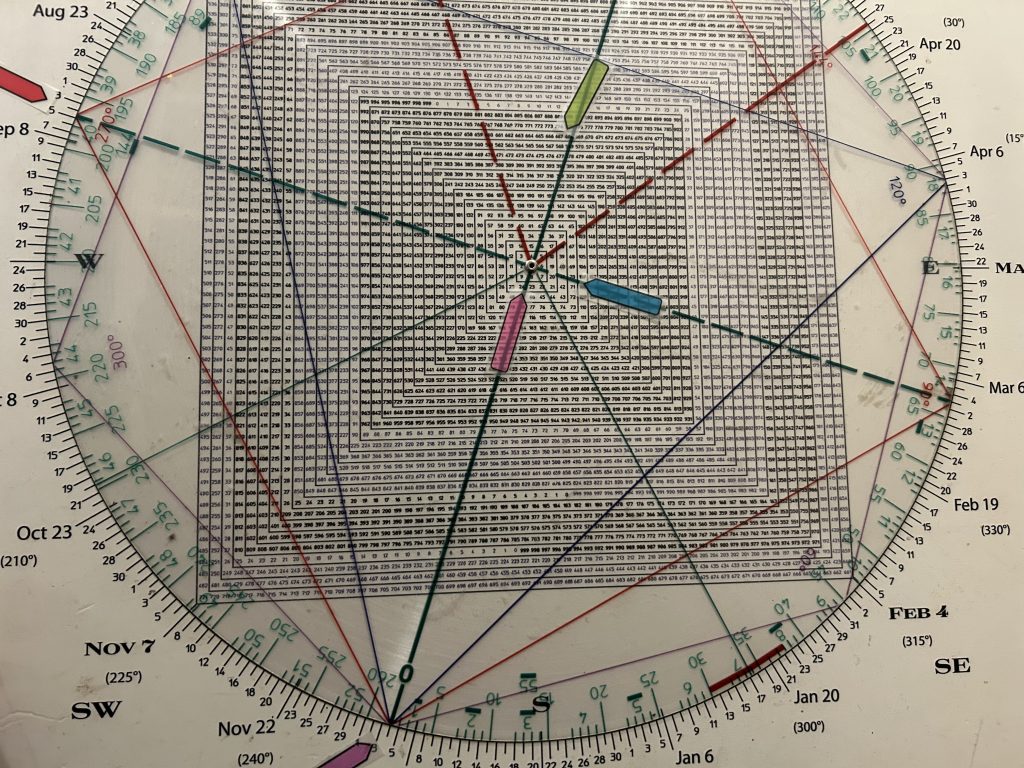
The cornerstone of these forecast being the Square of 9 Time/Price Calculator pictured below.

Square of 9 Wheel
Purchase your own Square of 9 Wheel. Shipping to US only. Contact Jeff for shipping outside the US.