“The human animal never behaves as wisely as he means to, particularly when his counselor is Hope or Fear.” Edwin Lefevre
“I gotta line on you.” I Got On You Babe, Spirit
A Funny Thing Happened on the Way to A Bullish 10% Correction
Mr. Market’s job #1 is to deceive the most players as possible
He good.
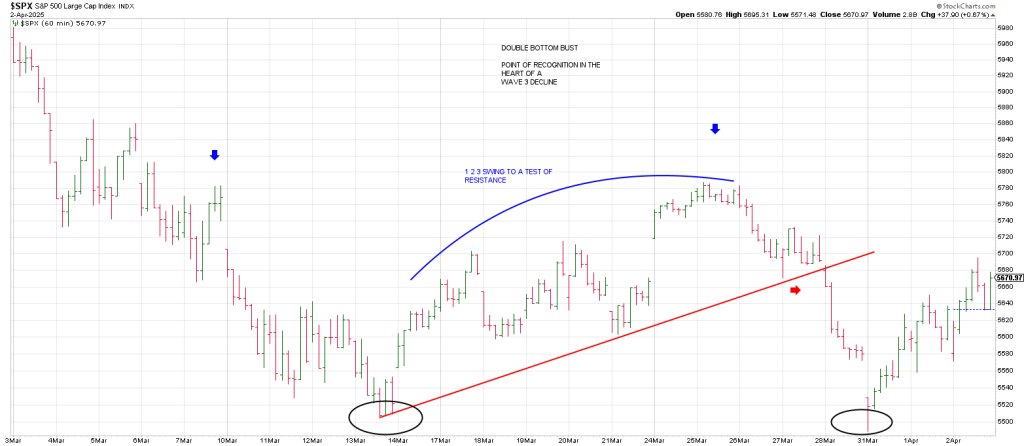
Out thinking has been that Monday’s Undercut & Rally test of the March 13th low would perpetuate Hail Mary’s that a successful test had been installed, that the ‘normal’ 10% correction had put in a low and a new leg up was on the table.
Instead, after Wednesday’s close they got a come to Jesus moment.
Indeed Wednesday’s gap down held our key 5562 support, nailed a low on the open and exploded 120 SPX points…fomenting some good old fashioned FOMO.
I must confess when the SPX cleared the 5636 square, with a pullback holding that region and then rallied again, I glommed onto the idea that a C Wave corrective rally would push toward the 5778 March 25th peak was being reinforced.
After Trump’s Tariffs were unveiled, the market underpinned that presumption with a strong rally.
Briefly. Very briefly.
Then the boom was lowered.
The market did a good impression of the Titanic after hitting a tariff iceberg, it’s keel rose in to the breach sinking below the supposed “double bottom”
The buy the dip lifeboats permeate the murky afterhours abyss.
The Iceman Cometh on the Heels of the Postman Ringing Twice.
Allow me to explain. The Postman rang a bullish bell with Monday’s upside reversal.
Then the door bell rang again with a certifiably bullish ring with Wednesday morning’s immediate reversal after a deep crimson open.
The bulls opened the door on Wednesday’s reversal to find a gorilla had rung the bell…after the closing bell.

In sum, the SPX was eviscerated from a SECOND daily Minus One/Plus Two sell setup.
The 3 Day Chart was pointing down and the SPX carved out 2 consecutive higher highs polishing off the setup on Wednesday mirroring the March 25th -1/+2 sell setup.
After the close the futes had a 120 point decline in 10 minutes obliterating Monday’s key low in a mega Keyser Soze sell signal—a Reversal of a Reversal.
The Keyser’s timing was spot on: the Gann Panic Window opened on Friday.
And while Monday’s reversal looked good, Time is More important than price.
The Panic time factor exerted its influence.
While the claim can be made that Trumps Tariff’s may be more severe than expected, the fact is The Cycle was pointing down and the news breaks with the cycles, not the other way around.
Surprises happen in the direction of the trend.
In a bull trend Monday’s reversal would never have looked back.
Like August 2024.
That August low is 5119.
As we have offered, the August lows were on deck…”pay me now or pay me later”.
It looks like now.
The mid-point of the August low to the Feb 6147 all-time high is 5633.
Basically in tandem with the 5636 square-out up from Monday’s low.
Monday’s low is critical because it is 360 degrees down from the March 25th high.
Breakage below opens the door to where the blowoff from 8/5/24 started—-5119.
Let’s look at the “cube-outs” (540 degree levels) down from the all-time high.
540 degrees down from 6127 = 5685.
Sound familiar? This ties to Wednesday’s highs where the SPX was rejected.
The next 540 degrees down (1080) = 5242.
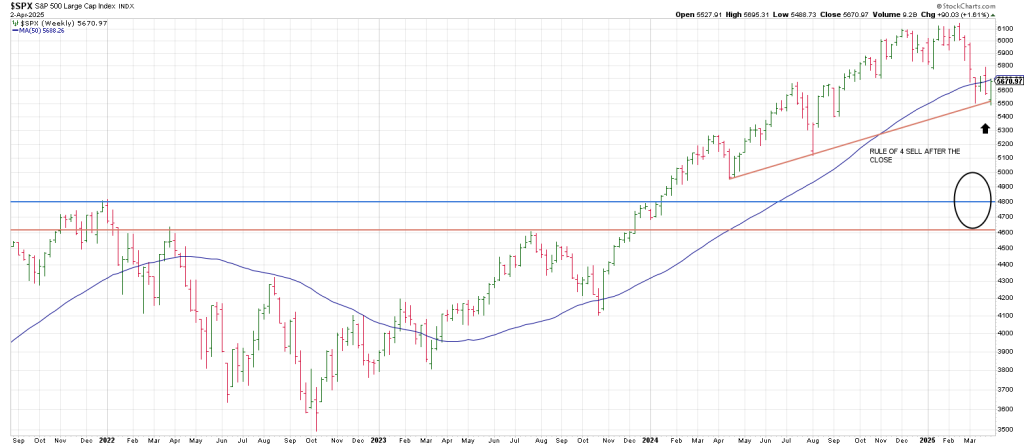
Breakage below 5242 or the third decrement of 540 degrees down (1620 degrees) = 4816.
Sound familiar?
It should 4818 is the January 2022 bull market top.
In other words, the SPX 6147 top is 1620 Fibonacci degrees up from the January 2022 top.
They are harmonically related as Gann would say…proving the math.
We know that the March 13 low was a Time/Price square-out as March 13 squares 614/615 (6147).
Consequently breakage below the square-out is a bearish event.
The Wheel shows that 360 degrees down from 614 is 519 ), 5190.
The presumption is 5190 plays out quickly in the midst of a waterfall.
In sum, the scenario has been that the market was/is in a crash pattern following the eclipse cycle outlined over the last quarter.
As offered in this space and on the private twitter feed, if the March “double bottom” was penetrated, the likelihood of a crash becomes significantly elevated.
As of Monday/Tuesday stocks were at the point where other recent developing crash patterns have failed over the last few years.
This Wednesday nights break is extremely critical as the SPX has triggered a Rule of 4 Sell signal.
From our perspective stocks remained historically expensive and extremely leveraged.
During the phase when speculators increasingly leverage their positions in an advancing stage, the leveraging paints a distorted picture of “efficient markets and strong liquidity”.
Yet nothing could be further from the truth. Liquidity potential moves opposite to leveraging trends, and the liquidity problems only become obvious when speculators are forced to sell in a declining market—often being forced TO SELL A ANY PRICE.
The deteriorating liquidity had become apparent from the daily swings up and down of 100 point sin the SPX.
These have become commonplace, while being rare just two months ago.
As the panic unfolds and liquidity decreases further the daily SPX swings could increase to a range of 200 to 500 points.
We already got -200 yesterday..
When this happens, stocks will be in a full-fledged crash. Volume will soar. He spread between bid and ask prices will increase dramatically.
And the daily VIX should rise to 100 or higher
The lead dog, the QQQ turned its 3 Month Chart down after the close.
It has 3 consecutive monthly lower lows.
The last time it had 3 consecutive monthly lower lows was the major low in October 2023.
That turn down in the 3 Month Chart defined the low.
A turn down in the 3 Month Chart is a big deal.
Breakage below the turn down is a sign of the bear.
Tomorrow’s report will analyze the behavior/trends of the stock market when the 3 Month Chart has turned up and down.