“And little girls from Sweden dream of silver screen quotation.” Californication, Red Hot Chili Peppers
Yesterday the NDX dropped more than 3%.
To put this in perspective it went 17 months without a 3% drawdown.
3% drawdowns can happen in a bull market but a series of 3% declines happen mostly in bear markets.
For example there were clusters of 3% declines during the Covid Crash in 2020.
There were some 3% declines on the march to the late 2021 top.
There were clusters of 3% declines during the 2022 sell-off.
So the question is was yesterday’s 3% decline a one-off or the start of a cluster of 3% declines to play-out over coming months.
Coming after a 17 month stretch without a 3% decline argues that more will follow in short order.
History says that volatility as expressed by gaps is not an isolated event when gaps cluster.
Volatility begets volatility just as momentum breeds more momentum.
The SPX has two large down gaps within the last 6 days. Gaps translate into urgent selling (or buying).
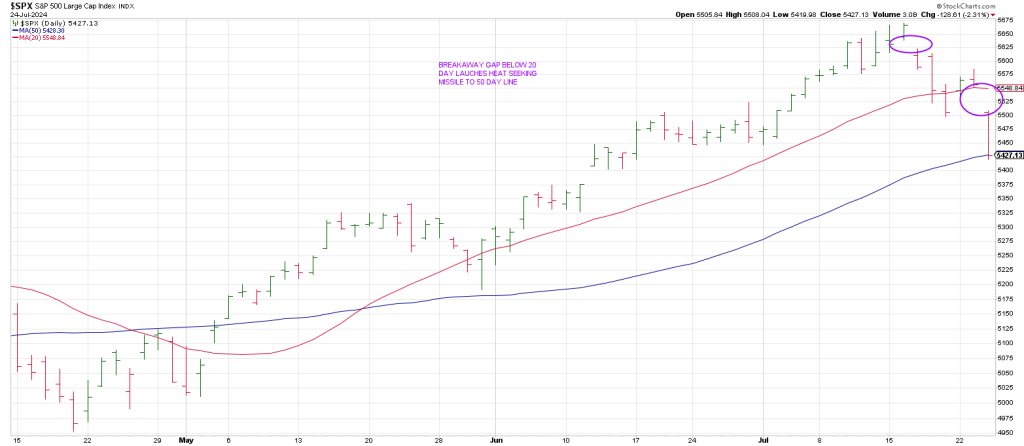
In the current instance July 17th saw a Breakaway Gap right off a record high and a Runaway Move.
This is unusual in and of itself.
Yesterday’s Breakaway Gap below the 20 day moving average was the exclamation point to our call for panic to hit the tape starting in mid-July.
If you were just following price action into July 16th, the SPX had done nothing wrong.
If you were paying attention to cycles you were on high alert.
As legendary market operator W.D. Gann wrote, “Time is more important than Price.”
What does all of Wall Street watch: Price.
Watch Time if you want to stay a step ahead of Mr. Market.
Time Turns Trend.
We’re not going to recap all the cycles that clustered this July but suffice to say that July 2024 is 92 years from the Great Depression price low on July 8th, 1932.
Why is this important?
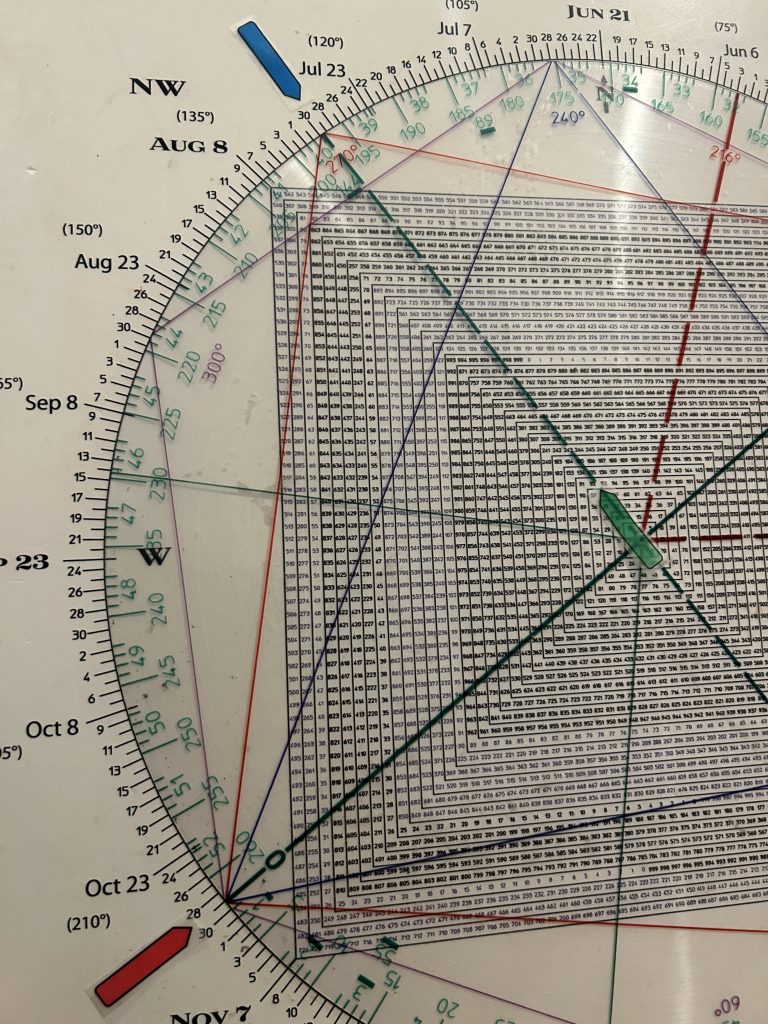
Well my Time/Price Calculator shows that 92 “points to” July 30/31.
92 also squares October 29th, the day of the Great Crash in ’29.
So, July 30th squares out/vibrates with October 29th
Said another way, since July 2024 is harmonic with the 1932 low 92 years ago in July, and 92 points to July 30/31, there is a strong likelihood that the end of this month will see extreme volatility.
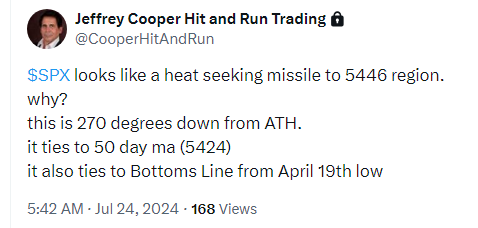
we posted the above before Wednesday’s open on the Hit and Run Private Twitter Feed.
The SPX dropped to 5420 fully testing its 50 day line before settling at 5427.
Will the test of the 50 day ma elicit a bounce?
Maybe, but Wednesday’s decline snapped a Bottoms Line connecting the October 2023 low with the April 2024 low and the May 31st low.
This is a big deal to me. It is breakage of a 3 point trend line…a Rule of 4 Sell signal.
Can the SPX backtest the broken trend line around 5480?
Of course it can. The market can do anything.
A rally attempt off Wednesday’s lows may targets 5493.
Why? This represents 90 degrees up from Wednesday’s low.
There is some good geometry there because Friday’s low was 5497 prior to a rally attempt.
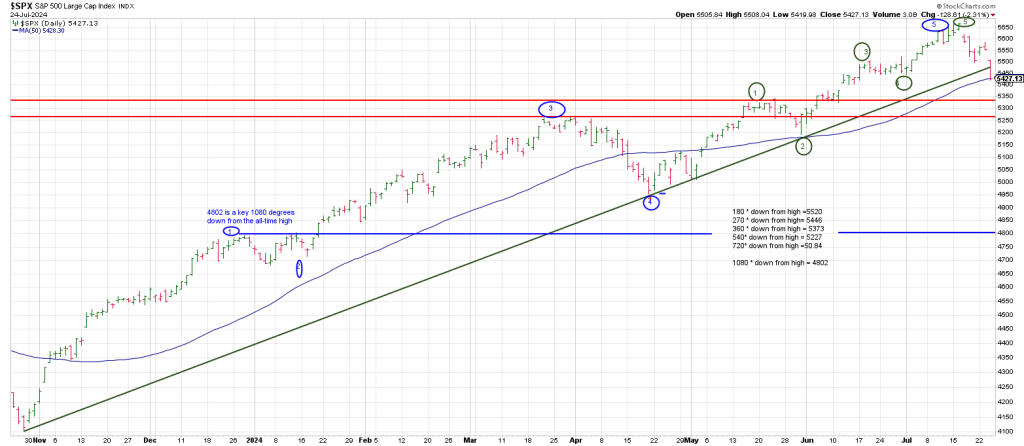
As well 180 degrees down from the all-time high is 5520.
So we have a well-defined band between 5493 and 5520.
270 degrees down from high is the aforementioned 5446 level
360 degrees down from high is 5373.
540 degrees down from high (a cube) is 5227.
720 degrees down from high is 5084.
Importantly 1080 degrees down from high is 4802.
Hit and Run members know the significance of 1080 degrees and I am doing a special report on this geometry for Monday’s report.
Suffice to say it is a major measure of market movement I discovered in my research for my DVD course, Unlocking the Profits of the New Swing Chart Method, which tracks the major SPX swings from 1941 through 2004.
Let’s drill down to the above daily SPX again.

4802 ties to the wave 1 high off the October 2023 low.
Notice the wave 1 high off the April 2024 low at 5341. That is the downside pivot if the 50 day line is broken.
Notice that 5341 ties closely to 360 degrees down which is 5373.
Downside follow thru targets 5373 to 5341.
Given the dual Momentum Gaps (gaps with follow thru) to the downside and full wave count at the highs the presumption is mid 5300 region will be seen sooner rather than later.
An hourly QQQ shows an impulsive 5 waves down to Wednesday’s low.
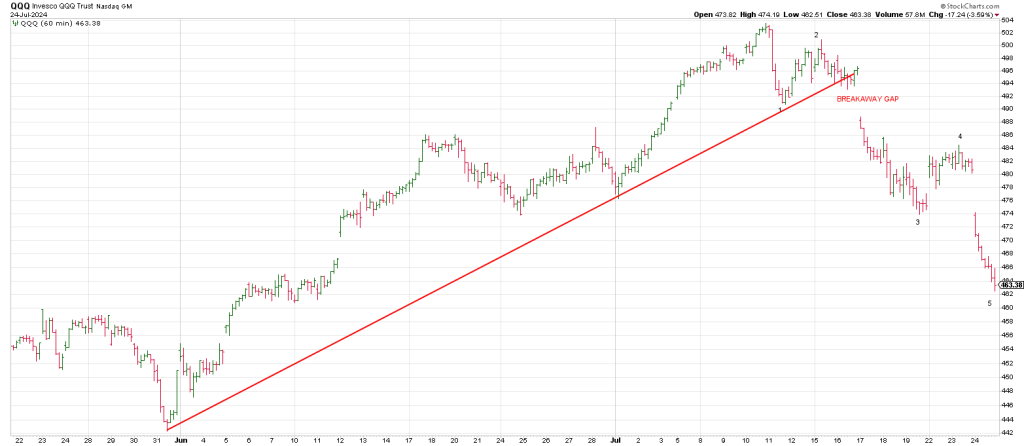
90 degrees down from the 503.50 record high is 481.
The Q’s knifed below the level with authority on Wednesday opening the door to 180 degrees down at 460.
Wednesday’s low was 462.50. Close enough for government work?
The market isn’t a Rolex, so that may be close enough to perpetuate a rally attempt.
Alternatively, a rally attempt this morning followed by an undercut of Wednesday’s low fully satisfying 460 may see the Q’s Jackknife higher to start a squeeze play.
Be that as it may, as you can see, Phil D Gap resides at 480…if the Q’s can get there.
In order for that to be viable, he Q’s must recapture the 50 day moving average at 472 and hold.
A rally that reclaims 472 may get players bullish at exactly the wrong time—thinking an Undercut & Rally pattern is calling a new leg up.
Instead, a gorilla will be ringing the doorbell. Think Trading Places.