Over the years, Jeff has accurately predicted major market ebbs and flows. He’s been spot-on with everything from the crash of March 2020, to the meteoric rise in precious metals prices in 2024.
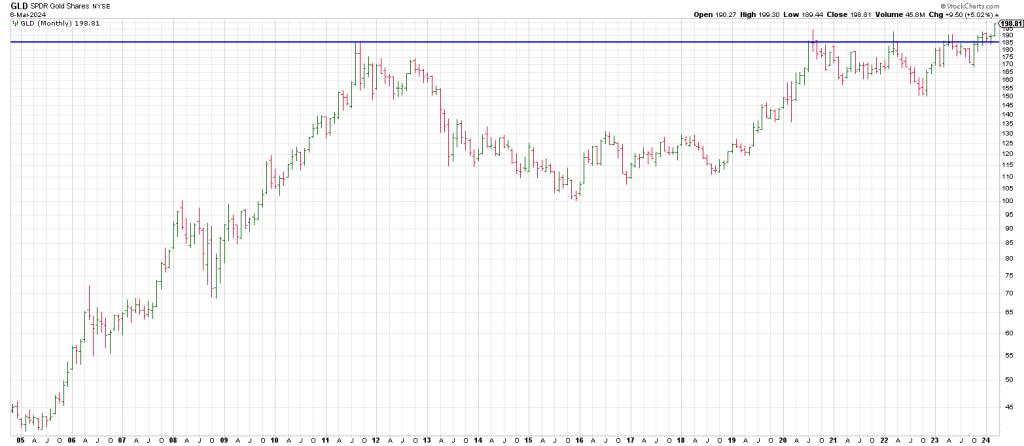
← Back to Powerful Market InsightsGold has gone nowhere essentially since it topped in the summer of 2011.

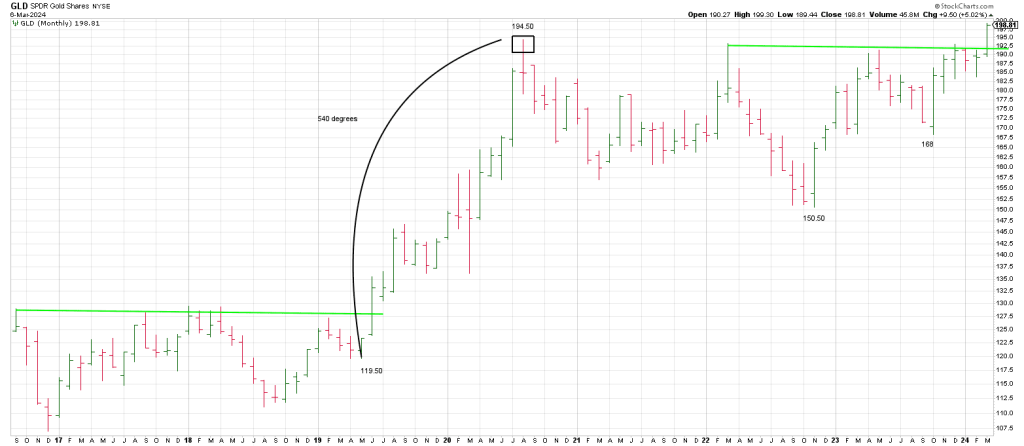
Aside from a vertical run when GLD exploded from a low of 119.50 in April/May 2019 to 195.50 in August 2020, GLD has tortured gold bulls and bugs.
I think there is a strong likelihood we’re about to echo the 2019-2020 parabolic run…at a minimum.
There was a Rule of 4 Breakout in June 2019 that kicked off the surge mirroring the Rule of 4 Breakout just triggered here in March.

Interestingly the 119.50 to 195.50 advance is a cube-out of 540 degrees.
If the current breakout mirrors that move measuring from the November 2022 low of 150.50 it projects a 540 degree rally to 233.
But first GLD has to clear 203 which is 360 degrees up from 150.50, the major Octobeer/ November 2022 low
GLD struck an all-time high of 193.40 on Wednesday.
In addition to 233 being a cube-out of 540 degrees from the 150.50 October 2022 low,
540 degrees in time or 18 months from October 2022 is April 2024.
Of course the SPX will also be 540 days/degrees from the October 2022 low this April.
Measuring from the October 2023 low of 168, a 180 degree move is 196,’
GLD eclipsed 196 on Wednesday closing at 198.81. This opens the door to the next decrement of 90 degrees higher or 210.
A full 360 degrees up from 168 is 224.
From the February 2024 low of 183.78, the 90 degree decrements up are as follows:
90 degrees = 198 which ties to Wednesday’s high
180 degrees= 212
270 degrees = 226
A full 360 degrees = 242
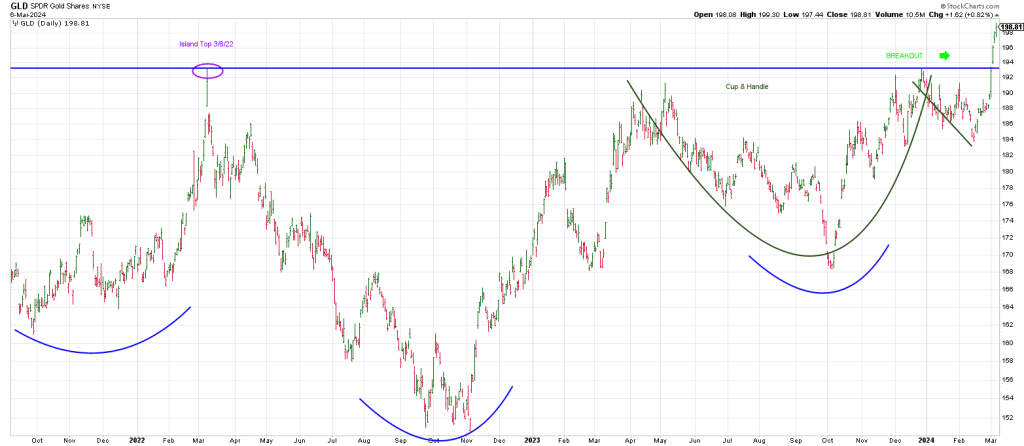
A big inverse Head & Shoulders pattern projects to 236.50.
This ties closely to the aforesaid 540 degree rally to 233.

The convergence of these two projections produces a strong likelihood that this 233/236 region will act as a strong vibration compelling GLD higher.
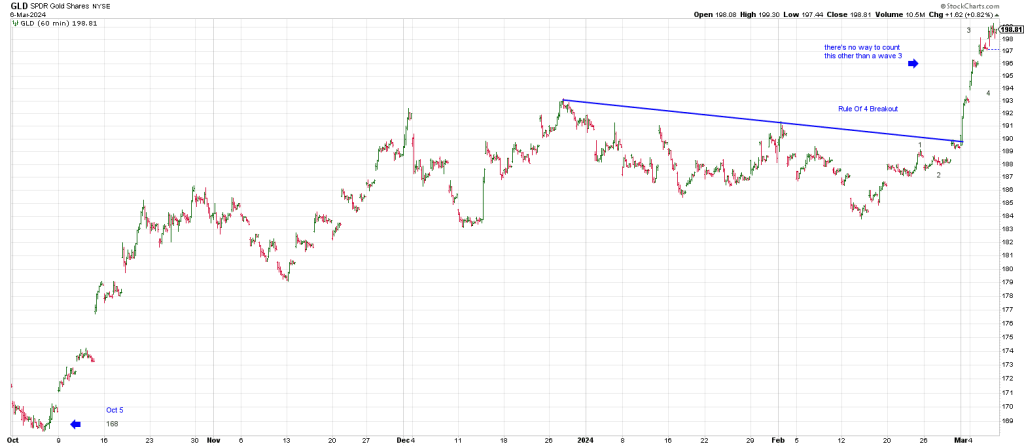
Drilling down to the short-term structure shows an hourly Rule Of 4 Breakout.

It would not be surprising to see a pullback from this region that carves out a minor wave 4 in this major wave 1 rally.
From there a 5th wave advance will complete a major wave 1 leg.
The expectation would be for a pullback to ensue from that juncture.
Then when the high for the move is exceeded, a melt-up phase will begin.
In sum, the best news for the bullish view in gold is that there is no news I’m aware of to account for the catalyst for this move to all-time new highs.
Following the spike to August 2020 nothing has happened:
After the initial pandemic panic, we didn’t see an inflation spike in gold.
Steadily rising geopolitical tensions over the last two years has not been the catalyst for the current breakout.
It’s incongruous.
It would be an extremely protracted and contracted trading range over the past 4 years even if “nothing” really had happened.
In fact, a lot of potential energy has built up.
In essence, volatility suppressed is volatility postponed and amplified.
Bullishly the turn down of the GLD Monthly Swing Chart in February pulled back the rubber band for the assault of the 194 high region extending back to August 2020.
Notably, GLD’s 3 Month Chart turned up in December and March’s breakout on the heels of a turn down of the monthlies in February is conspicuously bullish indicating this breakout will be sustained…just at the time when gold bears are all lathered up about shorting it because, well, it has worked so often for so long.
I suspect they will lay into the metals hard on the first sign of weakness.
This will just provide more fuel for the melt-up phase.
Most Western observes continue to underestimate the effects of Asian attitudes and flows on global commodity markets. This will now increasingly also apply to monetary alternatives to the U.S. dollar—ie gold and Bitcoin.
Bullishly, gold and Bitcoin have made new all-time highs in tandem this month.
So much for the idea the digital gold has replaced real money…gold.
As I like to say, correlation kills.
I don’t know what gold is sniffing out, Powell having to lower rates or the war cycles, but if GLD mirrors the duration of the 15 month run from the big June 2019 breakout it will be up throughout the year.
Near term this phase should extend into April.
