“I am flying, I am flying
Like a bird ‘cross the sky” Sailing, Christopher Cross X Rod Stewart
“When deciding to sell, people have control over whether to give themselves pleasure or give themselves pain, and they tend to give themselves pleasure. In other words, they tend to sell winners and hang on to losers. It turns out to be a bad idea.” Daniel Kahneman
“We live in an investment world, populated not by those who must be logically persuaded to believe, but by the hopeful, credulous and greedy, grasping for an excuse to believe.” Warren Buffett
Narratives are fun but the mind of Mr. Market is math.
If you’re trying to trade from the context of the news and funnymentals you’re flying by the seat of your pants in this market.
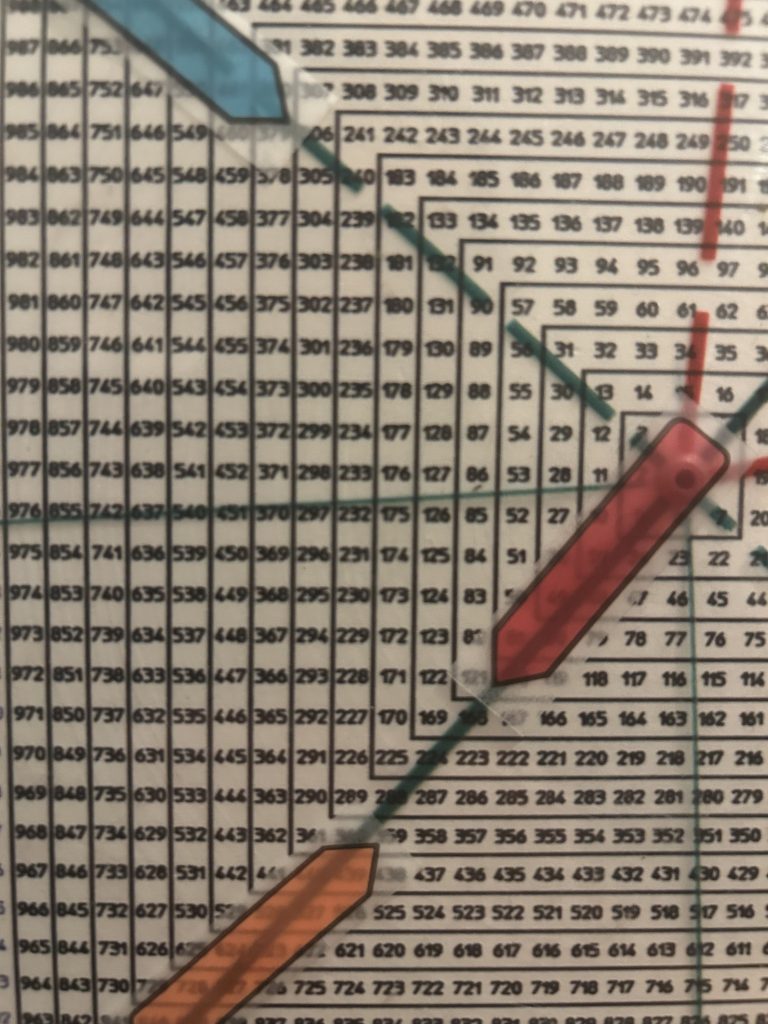
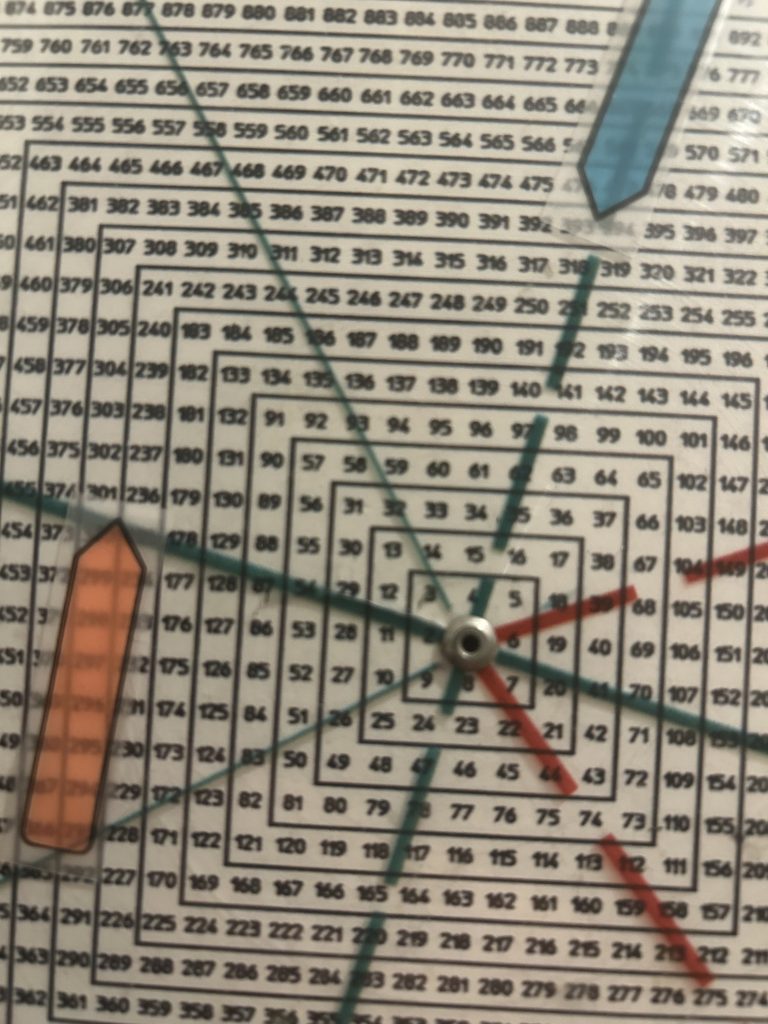
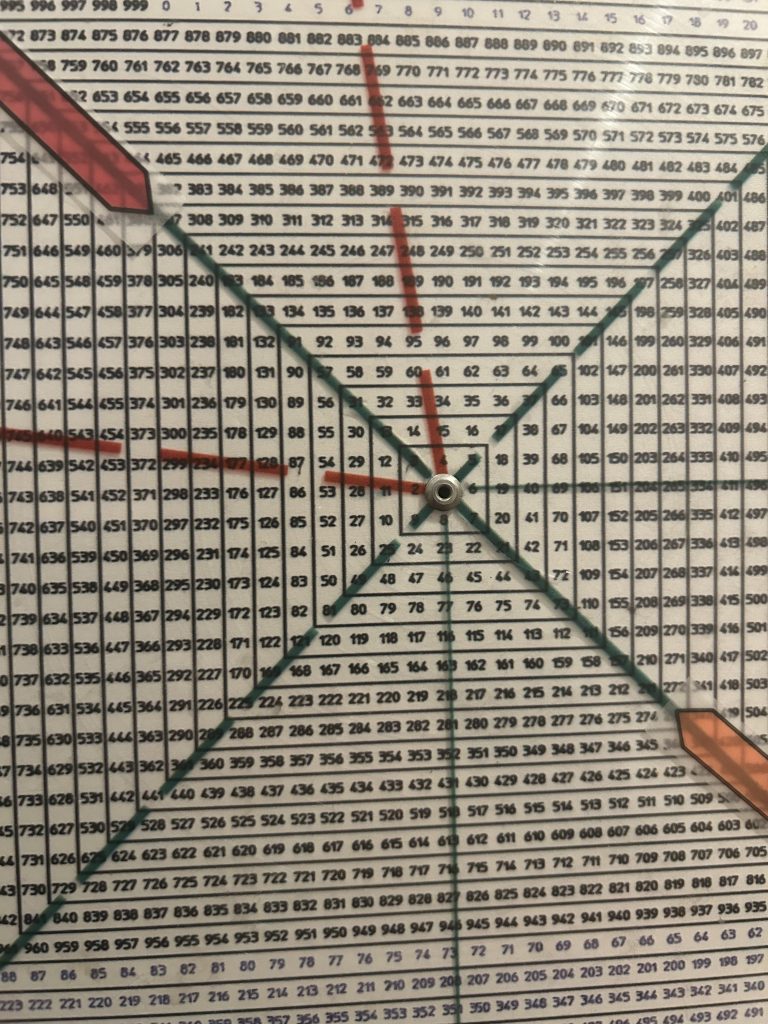
What you need is geometry, the language of the market.
Place picture of Sq of 9 here
There are lots of narratives as to why gold has been flying.
There are even more narratives since its attracted so much attention by separating
From “risk-off” in every other sector of financial markets.
Even the “digital gold” narrative of Bitcoin is taking gas breaking 80,000.
The narratives can drive you crazy.
They merely exist to backstop your own opinion.
There’s a narrative to satisfy every opinion.
There are no gold guru’s.
Only THE Cycle….
And the price to confirm the cycle that that will put you on the right side of the trade.
Let’s do the math.
A monthly GLD shows the monthly Rule of 4 Breakout in March 2024.
A Rule of 4 is a breakout over a 3 point trendline. History shows you don’t find many quadruple tops.
The 4th time thru is usually the real deal.
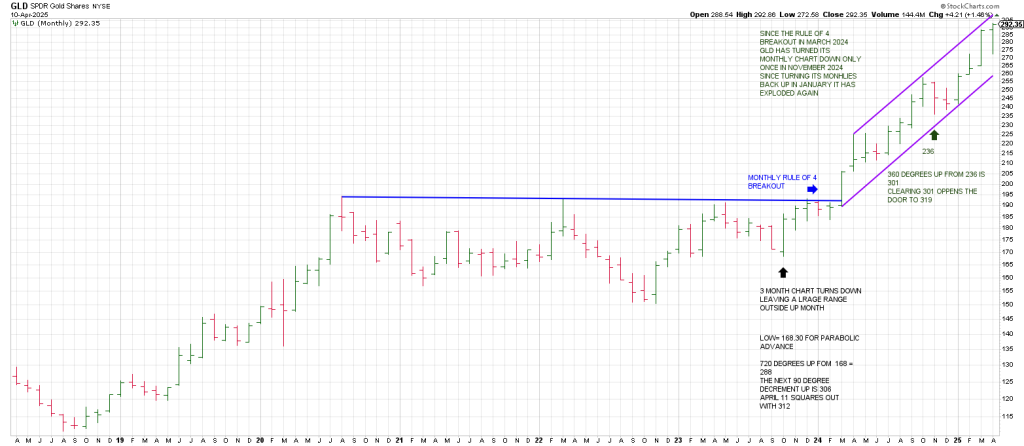
Notice that the 3 Month Chart turned down in October 2023 in league with the SPX defining a low.
GLD left a large range outside up month in Oct 2023.
That low was 168. It is the impulse from which to measure the current vertical run in GLD.
720 degrees (2 full revs of 360 degrees ) up from 168 is 288 which ties to the early April high.
The next 90 degree decrement up is 306.
At the same time April 11th squares out with 312.
Since the Rule of 4 Breakout in March 2024 GLD has turned its monthly chart down only once. That was in November 2024. This is the very embodiment of a runaway move.
When it turned its monthlies back up in January it exploded again.
360 degrees up from the November monthly turndown low of 236 is 301.
There are multiple indications pointing to the low300 region.
Clearing 301 opens the door to 319
GLD is set to breakout over the top of a monthly channel which should define a dramatic spike.
Drilling down to the weeklies shows a fractal of the monthly Rule of 4 Breakout occurred in August 2024.
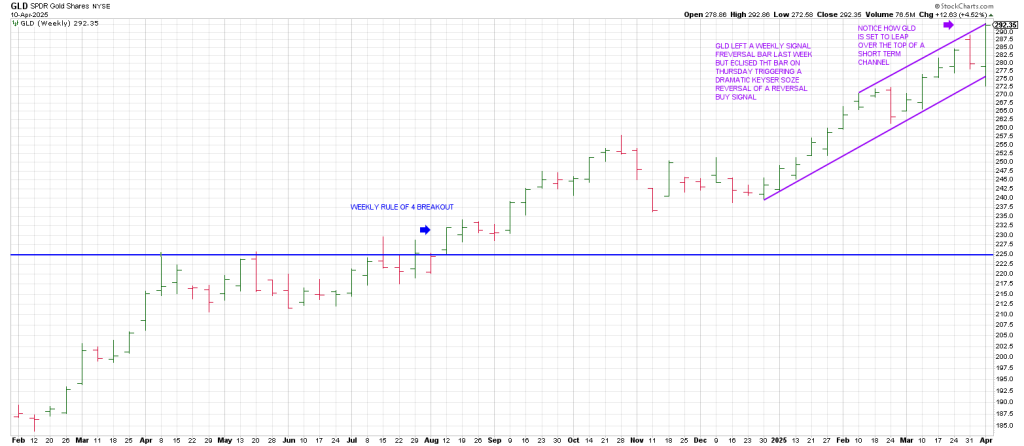
GLD rallied in tandem with the market into February. When the SPX rolled over in Feb, so did GLD….for one week.
Since then GLD has diverged from the SPX: it exploded in March as stocks imploded.
GLD left a weekly signal reversal bar last week but eclipsed that bar yesterday triggering a dramatic Keyser Soze Reversal of a Reversal buy signal.
Notice how GLD is set to leap over the top of a short term channel.
A daily GLD shows the significance of the 3 Day Chart in determining the trend.
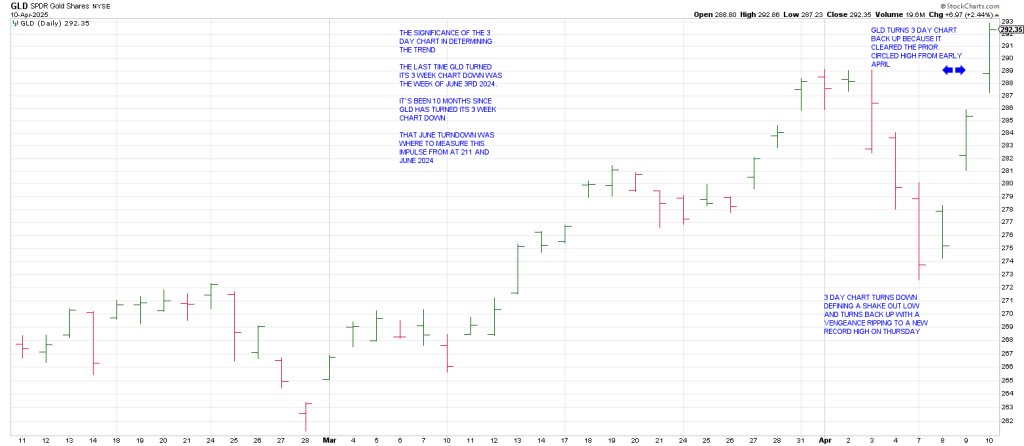
The last time GLD turned its 3 Week Chart down was the week of June 3, 2024.
It’s been 10 months since GLD has turned its 3 Week Chart down, defining the uptrend.
That June turndown was where to measure this impulse from:
At 211 and June 2024.
Interestingly 301 cubes-out the 211 low. In other words 301 is 540 degrees (a cube) up from 211.
GLD dropped sharply into last Friday turning its 3 Day Chart down in a test of its 50 day line.
That Combo setup produced upside acceleration.
Yesterday GLD turned its 3 Day Chart back up…not because it traced out 3 consecutive higher daily highs…it didn’t, but because it cleared the last circled 3 Day Chart high from April 3rd.
Very bullish action.
GLD has spiked sharply the last two days. There is a strong likelihood we see a continuation of this action today.