“Push the trigger and pull the thread,I gotta take it on the other side.” Otherside, Red Hot Chili Peppers
“I had an inheritance from my father,
It was the moon and the sun.
And though I roam all over the world,
The spending of it’s never done.” Ernest Hemingway, For Whom the Bell Toll
“It is an old cliché that they don’t ring a bell at the tops and bottoms of markets, but it is not entirely true. Occasionally someone climbs up in the belfry and does just that, as a public service, but knowing that few are likely to heed the bell.” Bill Miller
Is a 92 year old bull market from the July 8th Great Depression low ending?
That’s the question in this article.
Although it may not seem like we’ve had a blow-off that would be fitting of a 92 year advance, the SPX is up 9 fold since the 2009 bear market low—much more than any prior bull market.
The NDX is up 18 fold in the last 15 years.
China doubled since the 2009 lows. 50 blue chips in Europe doubled and 1/2.
As well flagged in this space, 6100 represents a Measured Move in price.
From the 2022 low to 6118 has equality with the advance from the 2020 low to the Jan 2022 peak.
We are 5 years from the 2020 low, more or less.
The 5 year cycle is important.
We have the 5 year run from 1932 to 1937.
It is 5 years from the 1982 low to the 1987 top.
It is 5 years from the 1995 impulse to the 2000 top.
It is 5 years from the 2002 bear low to the 2007 top.
Remember what is called the Roaring Twenties is really the 5 years from the breakout in 1924 into the 1929 peak.
January 2025 is 5 years from the January 2000 orthodox pre-crash high.
March 2025 will be 5 years from the March 23 Covid Crash low.
Remarkably there were reports of a new Covid strain from the Wuhan Lab on Friday.
How much that played into Friday’s Crimson Tide, I don’t know, but I heard little about the story over the weekend.
So perhaps that is why the bounce this morning.
Be that as it may, the news breaks with the cycles, not the other way around.
Let’s look at the market 5 years ago and the current time frame.
Below is a daily SPX for early 2020.
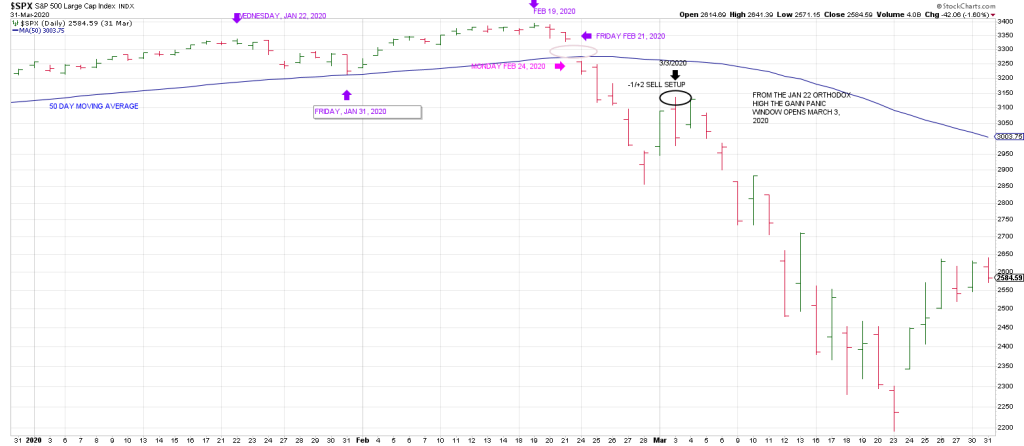
On Wednesday January 22, 2020 the SPX struck a high.
It pulled back into January 31st, 2020, where SPX made a pullback low testing its 50 day moving average prior to a nominal new high on February 19th.
On Friday Feb 21, 2020, the SPX turned down.
The next session Monday, Feb 24, the index gapped below its 50 day moving average turning its 3 Day Chart down.
The SPX got hit hard over the ensuing 4 sessions prior to tracing out a -1/+2 sell setup on March 3rd.
Notably despite being perched on a precipice, the SPX did not immediately follow thru after the -1/+2 sell setup…despite closing well off the highs on March 3rd.
Instead March 4th was a rally day, with the SPX closing on session highs.
It was a Miss Direction Day, a head fake.
These days are essentially the same with the same pattern here in January/February 2025.
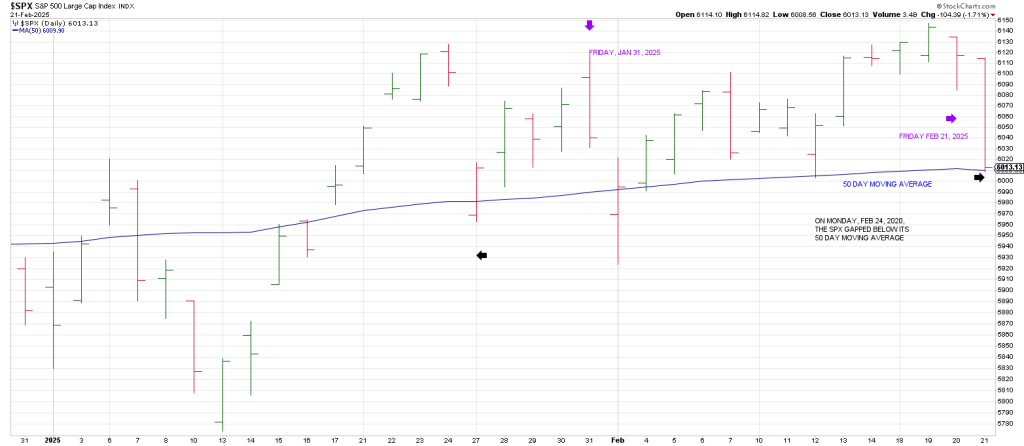
This year the SPX struck a high on January 23/24 (closing high versus intraday high) followed by a pullback into February 3, one trading day off from Friday Jan 31st.
The index undercut its 50 DMA on Feb 3, but rallied to close near session highs, perpetuating a nominal new high.
In 2025, as in 2020, the nominal new high was on February 19th. From there the index turned down trigger a Soup Nazi sell signal…an immediate reversal below the prior 20 day high.
In 2020, the SPX gapped below its 50 day line on Feb24th.
Interestingly, it rallied after the open into Phil D Gap before closing near session lows.
92 1/2 on the Square of 9 Wheel is 180 degrees straight across and opposite January 23/24, what I am calling the orthodox high for this period…until proven otherwise.
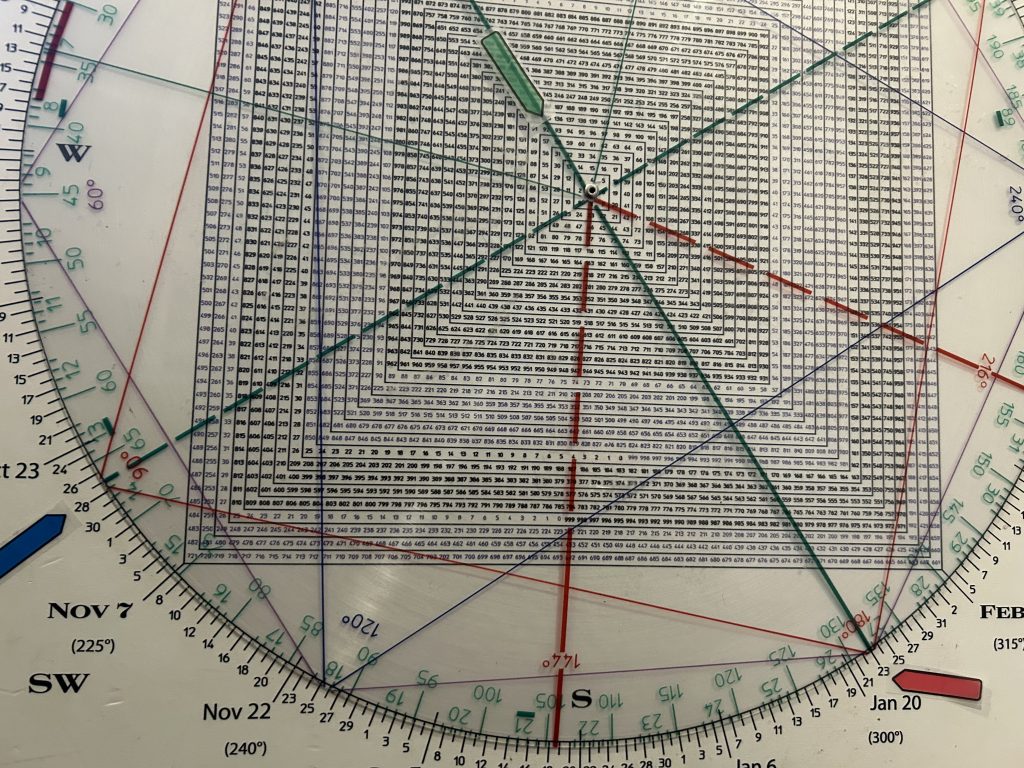
As well, notice that 92 1/2 squares October 28th.
This was the big crash day in 1929.
People always say THE crash was October 29, 1929, but the DJIA was down 13% on the 28th and 12% on the 29th.
In sum, January, 23/24 squares out with late October 28 and both square 92 1/2 as we are 92 1/2 years from the low following the ’29 crash.
Eerily, the January 2025 orthodox high is 1110 months from the July 1932 post-crash low.
On the Square of 9 Wheel 1110 “points to”/aligns with the first week of September (the high in 1929).
You can’t make this stuff up.
When has the market ever struck a new all-time high and dove 2% within a few days?
February 2020.
Caution is warranted.
Throughout history, newspapers have included 52 week high and low columns to provide investors with a quick visual reference of how much a stock’s price has fluctuated the preceding 12 months.
At present, the SPX is only 2.18% below its 52 week high.
Yet, 60% of stocks in the index are down 10% or more from their respective 52 week highs will 33% of stocks are DOWN 20% OR MORE.
This didn’t JUST occur. It’s not a function of last week’s selloff.
The slippage has been going on for months as we’ve flagged in this space.
The market itself is flat the past 3 months, but most stocks are struggling.
The internals for the Russell 3000 index (representing 98% of the investable U.S. equity market) are much worse with 81% of stocks in the index down 10% or more from their respective 52 week highs and a huge 55% of all stocks down 20% or more.
In a nutshell, more than half of all stocks in the U.S. equity market are down more than 20% from their 52 week highs.
We’re on the other side.