Whether your approach to markets is fundamental or technical, sentiment analysis can be a very important additional tool.
Today traders find themselves in an information maze: indicators and oscillators, systems and methodologies, gurus and self-appointed experts.
It can be overwhelming, producing confusion just when action is needed.
This is why I don’t rely on indicators. Sentiment is more potent than an indicator, but it is backdrop, not for specific timing. Sentiment tells you you’re on the right block, but doesn’t give you the address.
All indicators are based on price or price and volume.
They are of second degree magnitude. Why not go right to the horse’s mouth, price itself?
In my experience, indicators are more descriptive than predictive.
My point is this: regardless of what an indicator says, it is sentiment that determines the course of markets.
It is sentiment that produces positions and positions that determine trend.
If enough traders are bullish, even for the wrong reasons, then prices will rise.
You don’t need to know WHY those traders are bullish, only that they are willing to stay long and buy and drive prices higher.
There could be a myriad of reasons why the vast majority are bullish.
That is why I say: speculation is observation, pure and experiential. Thinking isn’t necessary and often just gets us into trouble.
Why creates sentiment? I believe there are cycles of optimism and pessimism.
What determines those cycles is not what this is about.
That’s a topic for later this week.
Suffice to say that a cluster of cycles are due to exert their downside influence in July.
What does sentiment look like in this market?
We have an historic extreme in the commitment to stocks from U.S. household.
The retail investor is committed to stocks—to an extreme.
Likewise Advisors are wildly bullish.
The Bullish Percent of Advisors jumped to 71 on June 17th and has remained there.
This is the most optimistic analysts and advisors have been in the past 5 ½ years—since January 2018.
January 2018 marked a top from which the market crashed 12% in 9 trading days.
Notice that the Last Ditch Rally from November 2017 to the late Jan 2018 top was 49 trading days.
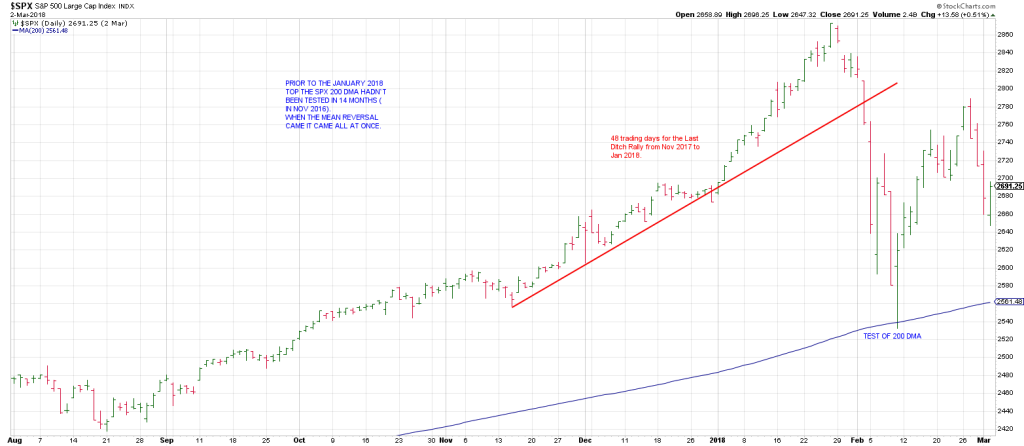
In late January 2018, it had been 14 months since the index had seen its 200 DMA.
When the mean reversion occurred it happened all at once.
A similar drop today like that from late January 2018 would take the SPX to around 4860.
Interestingly that ties precisely to the 200 day moving average.
The 200 DMA hasn’t been tested in 7 months, half the span of that at the Jan 2018 top. Nevertheless it’s stretched.
In late October 2023 the SPX undercut its 200 DMA for a week and quickly recaptured it on November 2nd.

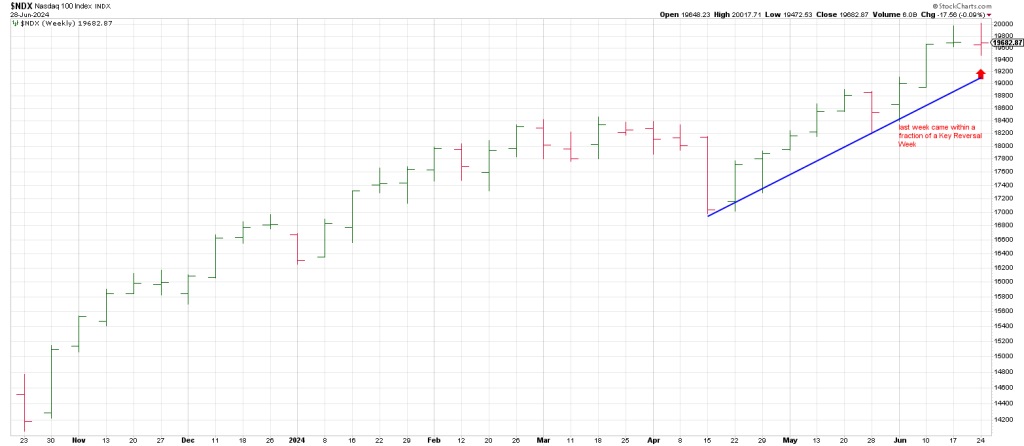
Notice that the persistent rally from the April 2024 low mirrors the Last Ditch Rally from Nov 2017 to Jan 2018.
In fact the rally off the April 19, 2024 low to Friday’s Key Reversal Day at record highs on the SPX is also 48 trading days.
Is it possible it marked a Last Ditch Rally as well?
Feelin’ lucky?
The Air Pocket from the late January 2018 top was called Volmaggedon because market optimism had been so persistent that investors were betting heavily that the market would continue higher with continued lack of volatility.
What caused market sentiment to shift so wildly on a dime?
There was no news event.
I submit it is the Time Factor. Cycles, natural cycles and market cycles.
Again, later this week we’re going to take a deep dive into cycles that I think will knock your socks off and curl your toenails.
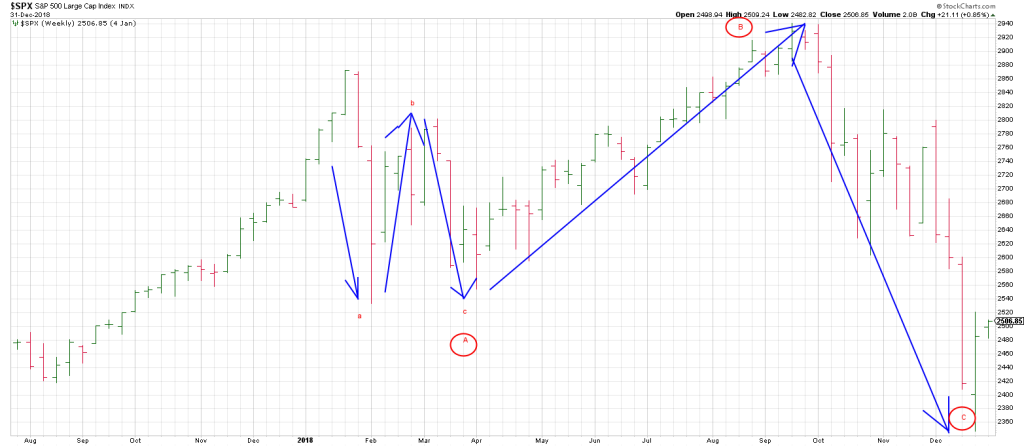
The January 2018 top and subsequent Air Pocketism did not just mark a 9 day reversion to the mean.
It kicked off a year of volatility. By the end of December 2018 the SPX had declined 24% from the late January 2018 top.
As the weekly SPX below reflects, it was a year of whiplash marked by an A B C decline with a marginal new high in September to set the hook for the vicious C Wave climatic selling.
In January 2018 bullish consensus was at 73 compared to 71 last week. To give you an idea, bullish consensus was around 68 in November 2021 when the NDX topped. (The SPX went on to notch up a slightly higher high on January 4, 2022).
Currently investors are highly complacent to an expansion in volatility and a decline in stocks.
At the NDX top on the week of November 22, 2021, the index left a Key Reversal Week.
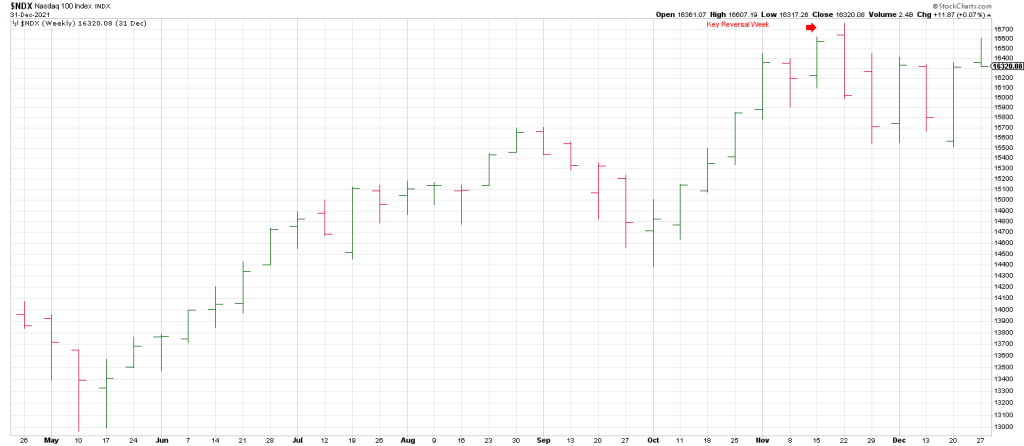
Believe it or not the NDX hasn’t scored a Key Reversal Week since.
Last week it came a fraction from leaving the first Key Reversal Week in 2 ½ years
Is it close enough for government work.?
Has the bull fired every shot left in his 44magnum?
Was last week’s reversal an SOB (Sign of the Bear)?
Feelin’ Lucky
Speaking of whether there are 5 or 6 bullets left in the chamber, the SPX generated a 5th Hindenburg Omen potential crash signal on June 20th.
This is a cluster of 5 since June 13th.
The odds of a stock market crash are rising.
These five H.O.’s compliment a cluster of 3 Key Reversal Day’s.
March 8th
May 23rd
And Friday, June 28th.
April 4th and June 20th are “in-the-sprit-of” runner up Hindenburg’s.
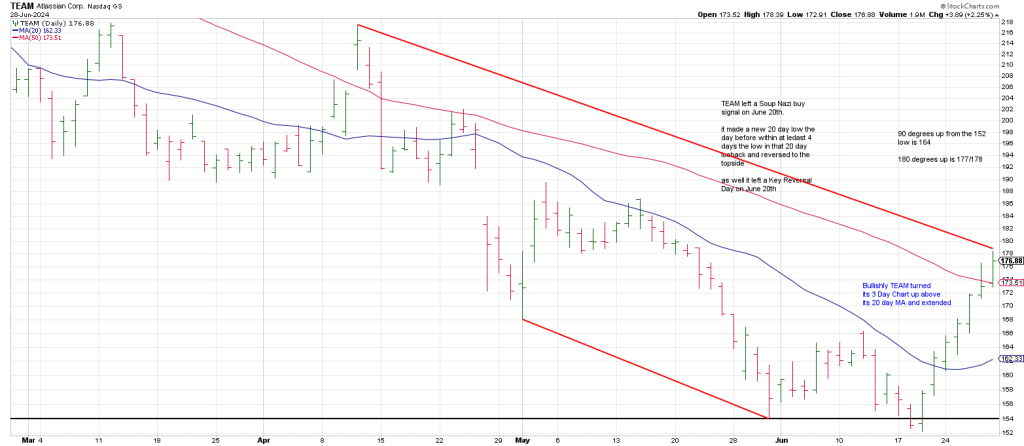
As well Friday produced a Soup Nazi sell signal.
This is because it made a new 20 day high but reversed back below the high of 20 days ago but with at least a 4 day interval. The 4 day interval is to guard against continuations.
In other words “no soup” for the chasers of new 20 day highs.
In sum my San Andreas Fault is flashing a warning by virtue of the following criteria:
- There is a significant bearish divergence over the last 7 weeks between the NYSE Cumulative Advance/Decline line which is falling and the SPX which is rising.
- We have a bearish intramarket divergence between the SPX and the NDX versus the Transports and the IWM.
- A cluster of cycles is due to exert its downside influence in July (which we will walk thru later this week)
- Jaws: 12 month lows are eclipsing new 12 month highs while the SPX and NDX are at record highs.
- Valuations are rich.
Several spheres of technical analysis are converging. They are shouting that a significant change in trend is imminent, one that will last at least several months.
Tape Reading Section


Square of 9 Wheel
Purchase your own Square of 9 Wheel. Shipping to US only. Contact Jeff for shipping outside the US.